Environmental Big Data and Xarray
Environmental Big Data
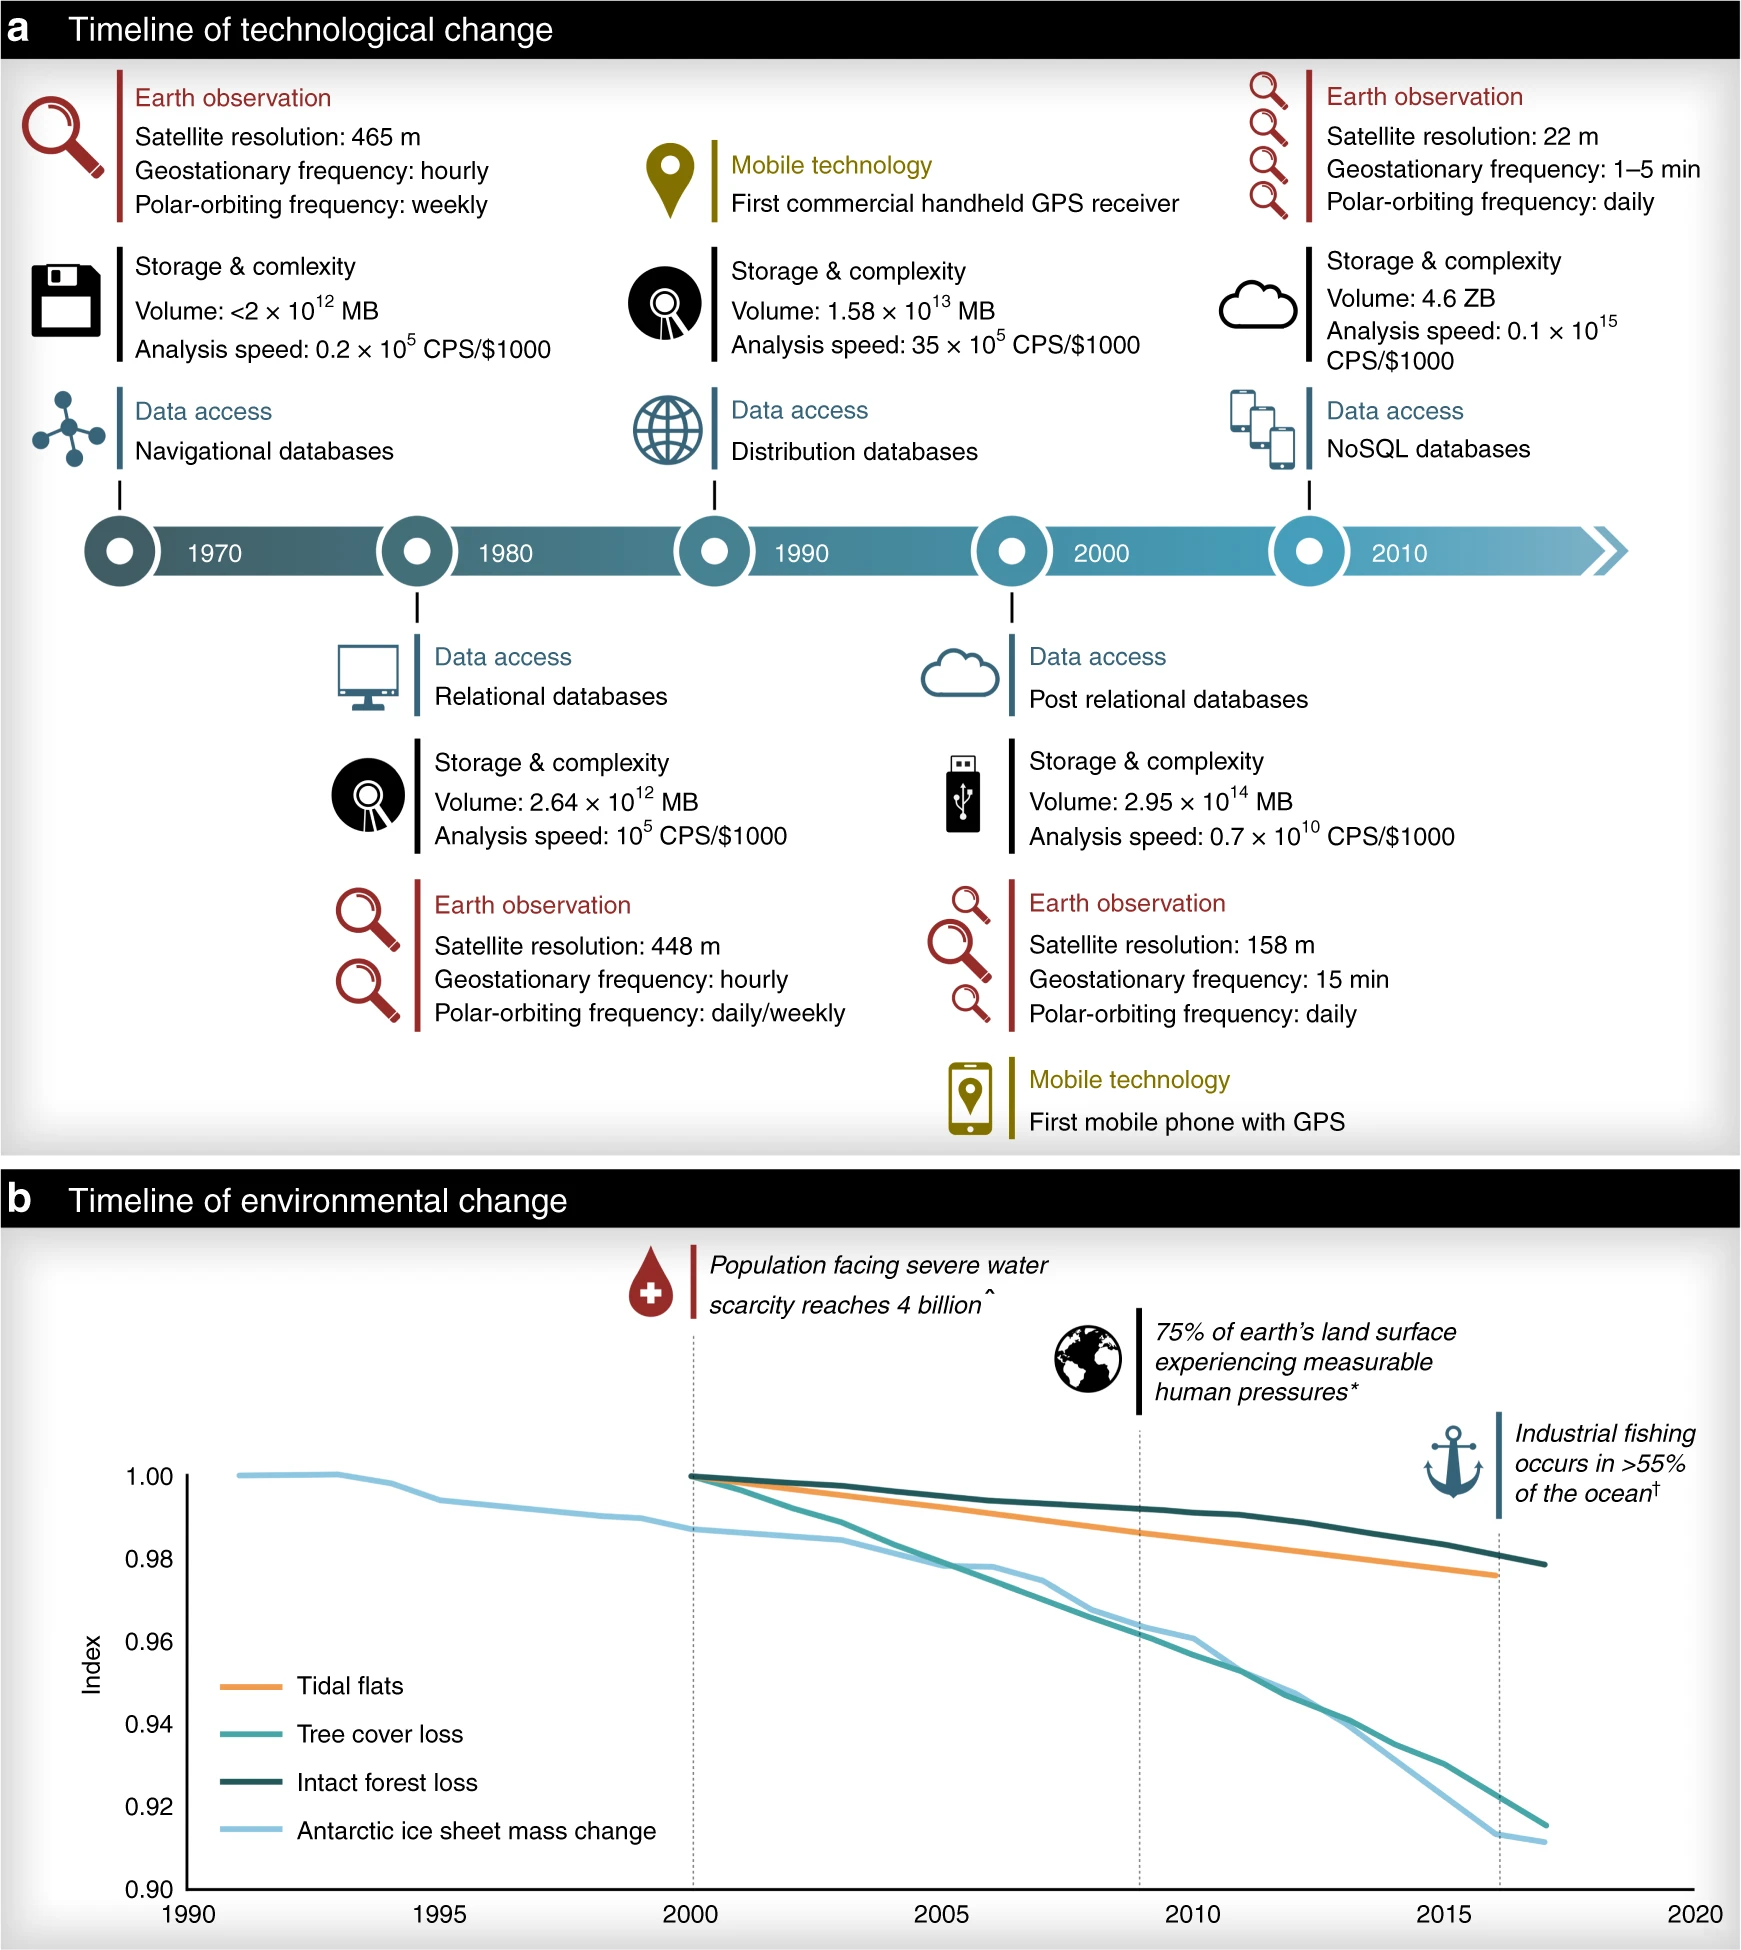
With the growth of satellite technology, environmental models, and computational capacity, environmental observations has entered the stage of environmental big data (Figure 1):
Companies like google have realized that these amounts of data are useful not only for environmental problem solving, but also for many other applications.
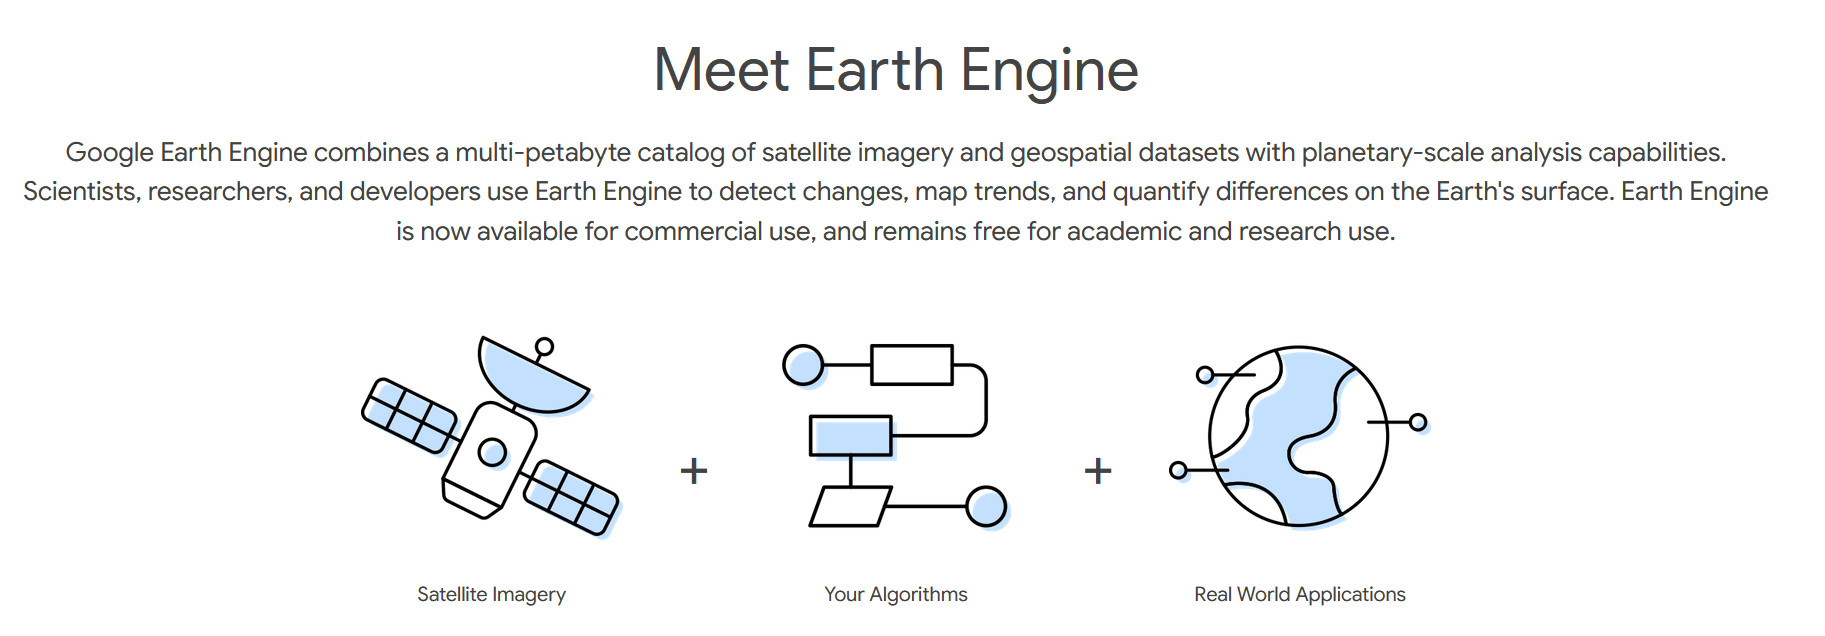
To give one example, google has curated more than 90 PB of Earth Data Products that have been integrated into Google Earth Engine, and data analysis platform using google cloud infrastructure (Figure 2).
What is special about big data?
Big data definitions may vary slightly, but it will always be described in terms of volume, velocity, and variety. These big data characteristics are often referred to as the “3 Vs of big data” Google Cloud
- Volume: This one is quite self-explanatory. We are now dealing with an incredible volume of data that is being collected from a large range of sources. Dealing with the sheer amount requires infrastructure for storing and processing all this data.
- Velocity: This is the speed at which data is being generated. Environmental measurements are automated and collected in real-time (or close to).
- Variety: Environmental data comes from many different sources and formats. Automated sensors, satellites, environmental models …
Pipelines and format
Because big data has volume and velocity is has to be handled in certain ways and there are data formats and processing pipelines that do so.
- Datasets are distributed across chunks that are stored in multiple files that reside on cloud servers and can be accessed by many computers at the same time.
- Because the entire dataset is too big to fit into the working memory (RAM) of a computer, datasets are indexed rather than read into RAM. For example, when opening a dataset with xarray, xarray will not actually try to read the data, but only load information about what is stored. Only when computations are executed to produce a result, the necessary data will be read into memory. This principle is also called lazy execution. This also requires the processing software to be efficient when interacting with chunked datasets.
NetCDF
A frequent data format for environmental data is the NetCDF format (*.nc) developed by Unidata:
Data in netCDF format is:
- Self-Describing. A netCDF file includes information about the data it contains.
- Portable. A netCDF file can be accessed by computers with different ways of storing integers, characters, and floating-point numbers.
- Scalable. Small subsets of large datasets in various formats may be accessed efficiently through netCDF interfaces, even from remote servers.
- Appendable. Data may be appended to a properly structured netCDF file without copying the dataset or redefining its structure.
- Sharable. One writer and multiple readers may simultaneously access the same netCDF file. (Unidata)
Zarr is becoming increasingly popular, and has become the de-facto standard for cloud storage with AWS or Microsoft.
Xarray
Xarray is a python library that is designed to work with multi-dimensional datasets. It has a similar syntax to pandas and includes many operations such as aggregation and plotting (Figure 3).

Datasets that are read into xarray have dimensions and variables that can be used to interact with the data. This makes it ideal to work with Earth data such as gridded datasets.
Gridded data products
Earth data is often organized as a gridded data product, with latitude and longitude as dimensions. Adding multiple times, or levels (for example height or depth of atmospheric or oceanic data)can lead to 3 or 4 dimensional datasets.
Weather data
Our first xarray example will be using weather data from a so-called reanalysis dataset.
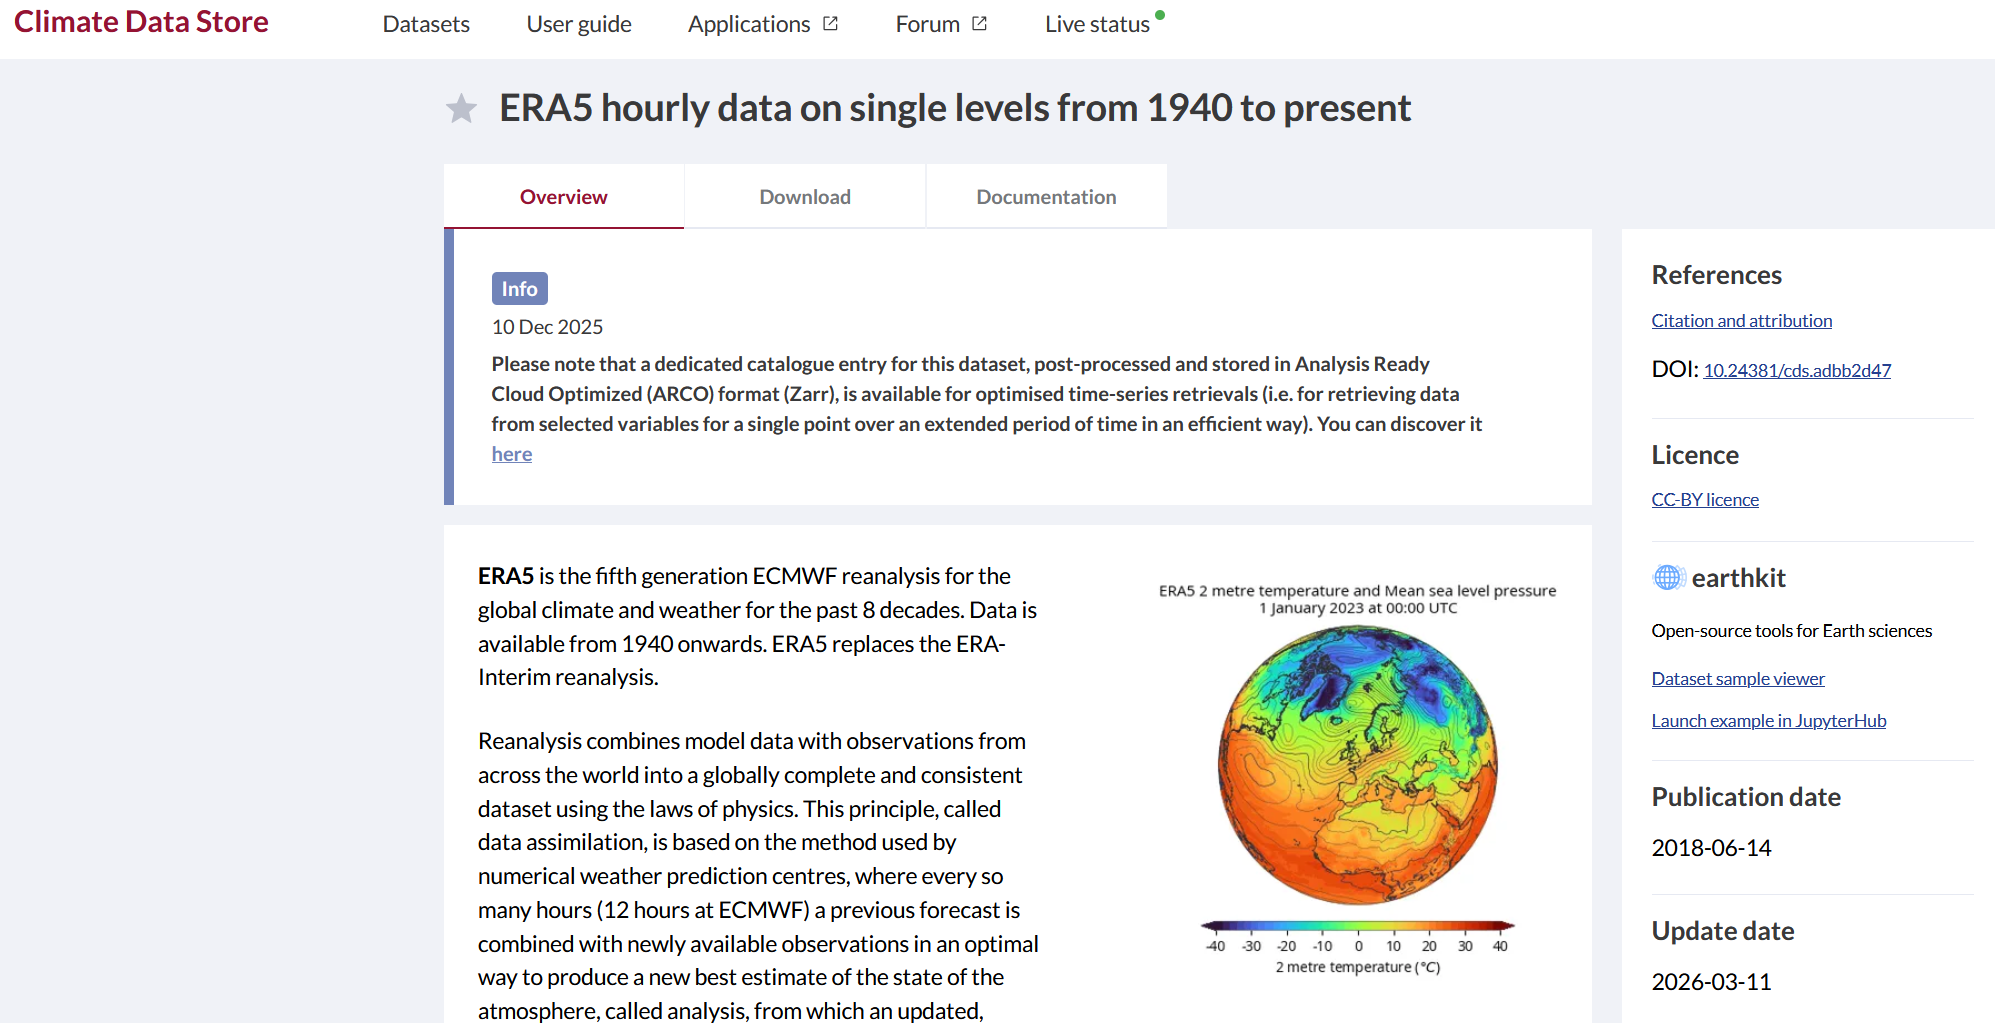
Reanalysis uses past observations of weather together with short-range weather forecasting models to create a globally complete (even where we don’t have any stations) picture of past weather and climate (Figure 4):

The European Reanalysis 5 (ERA5) is currently the most advanced and high resolution product. It covers the time period of 1940 to today at a resolution of 0.25 x 0.25 degrees and with hourly output
![]()
ERA 5 Overview There are also gridded data products that rely on statistical models to extrapolate observations to a grid. These tend to only work for areas with a high density of observation stations such as the US or Europe. Examples of these are:
- DAYMET at 1 km resolution produced by Oak Ridge National Labs
- PRISM Weather Data at 4 km resolution produced by Oregon State University
- GRIDMET at 4 km resolution produced by the ClimatologyLab.