flowchart LR
  A("<s>Data Collection</s>") --> B("<s>Data Cleaning</s>")
  B --> C(Data Analysis)
  C --> D(Data Visualization)
  D --> E(Data Communication)
3. Open Data, Tools, and Workflows
Recap: Data Analysis Workflow
We can describe the data analysis workflow as a linear sequence of steps (Figure 1):

Figure 1: Environmental Data Analysis Flowchart; Credit: NumberAnalytics
However, this workflow is embedded into a larger context of doing open-science.
Recap: Open Science and Workflows
Open and reproducible science is a collection of practices (Figure 2) that allow us to easily share, work and collaborate with others1.

FAIR and Open Data
It is impossible to know from the csv that I shared with you, what the data represents.
The dataset I shared is the global carbon budget for the year 2023 (Figure 3), which is compiled by the Global Carbon Project:
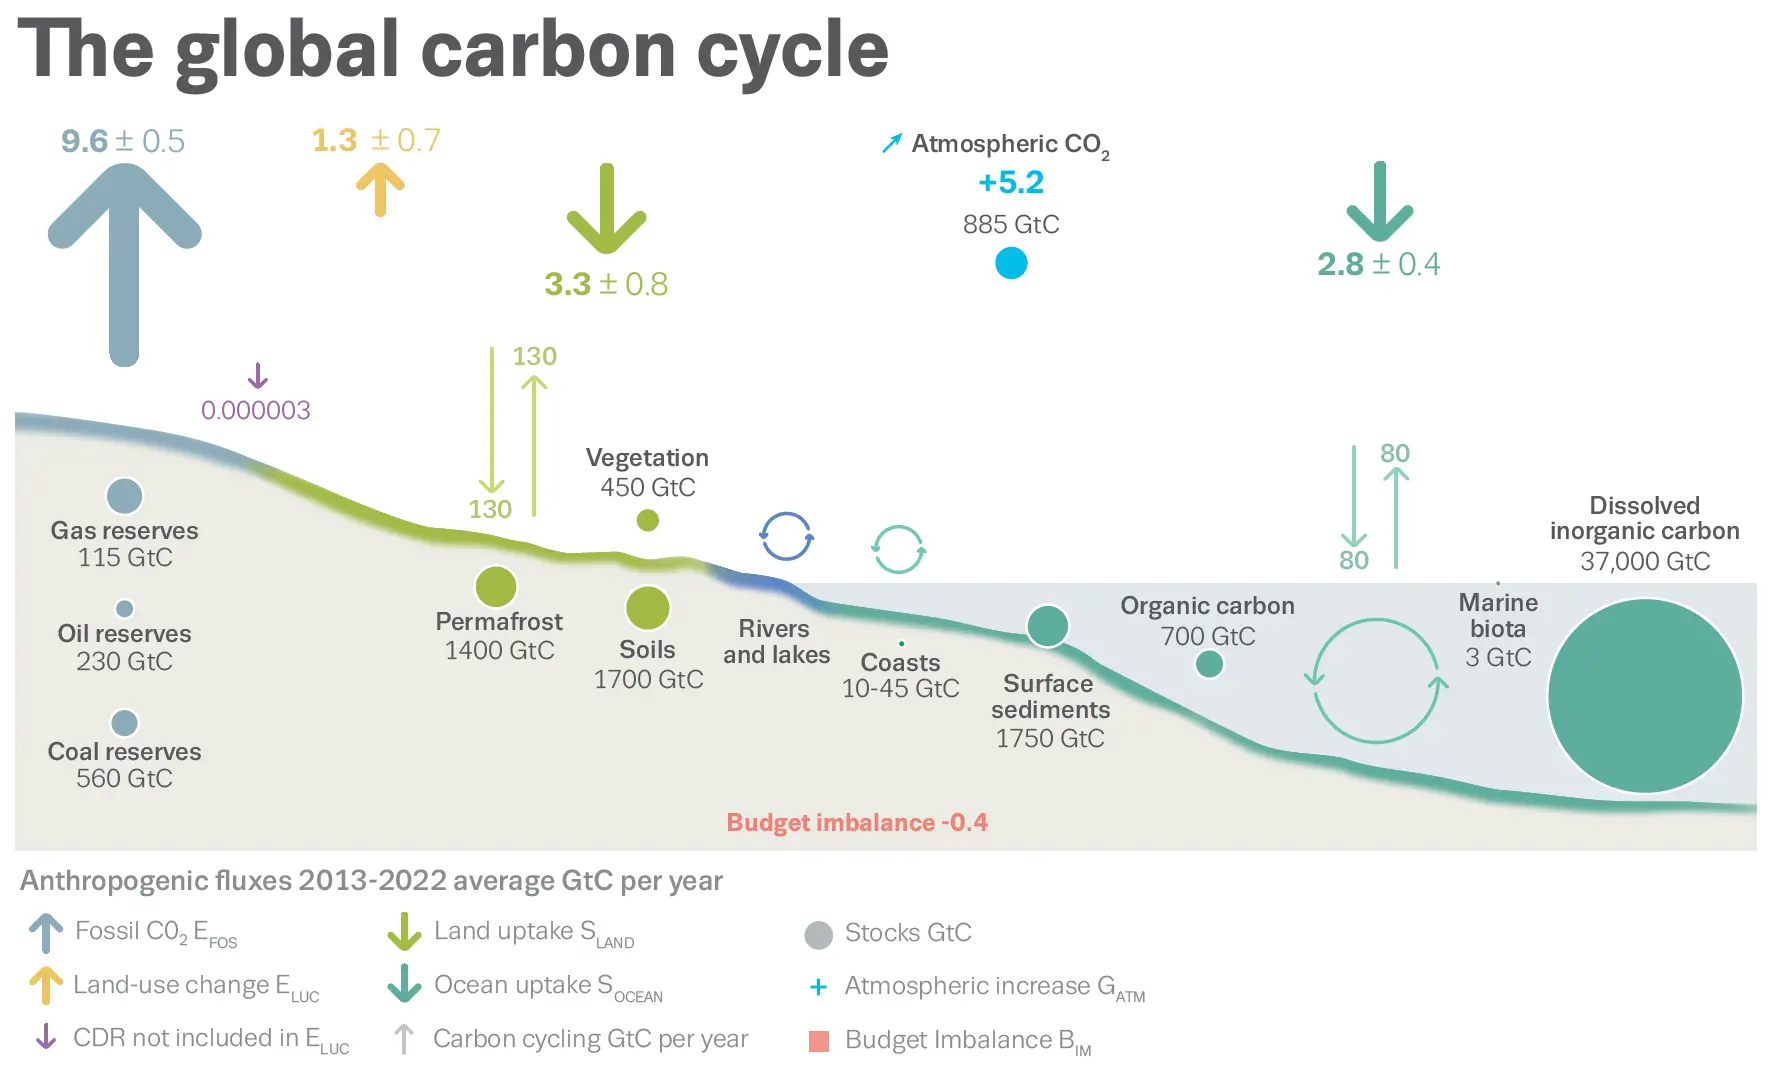
This dataset is actually fairly well described and documented. This includes the website and an article in the open-access journal: Earth System Science Data1
Git and GitHub for Transparency and Reproducibility
The code I just demonstrated is part of a git repository that is hosted on GitHub.
This means that any changes to the code are tracked within the git repository and the code is also quasi-archived.1
We use git and GitHub as a version control system (Figure 5):

This also means that different users can make independent changes to the same document (Figure 6):

If there are conflicts between the users’changes, these conflicts can be resolved by choosing which changes you want to keep (Figure 7):

Git and GitHub for sharing and collaboration
Getting Code from GitHub - Git workflow: Fork and Clone
Let’s say we are doing open-science and have found some freely-available code on GitHub that we want to build on. What can you do to get started?
Create a Copy of Other Users’ Files on GitHub.com (Fork a Repo)
Using GitHub.com, you can make a copy of a GitHub repository (also known as a repo) owned by another user or organization (a task referred to as forking a repository).
To fork a repo:
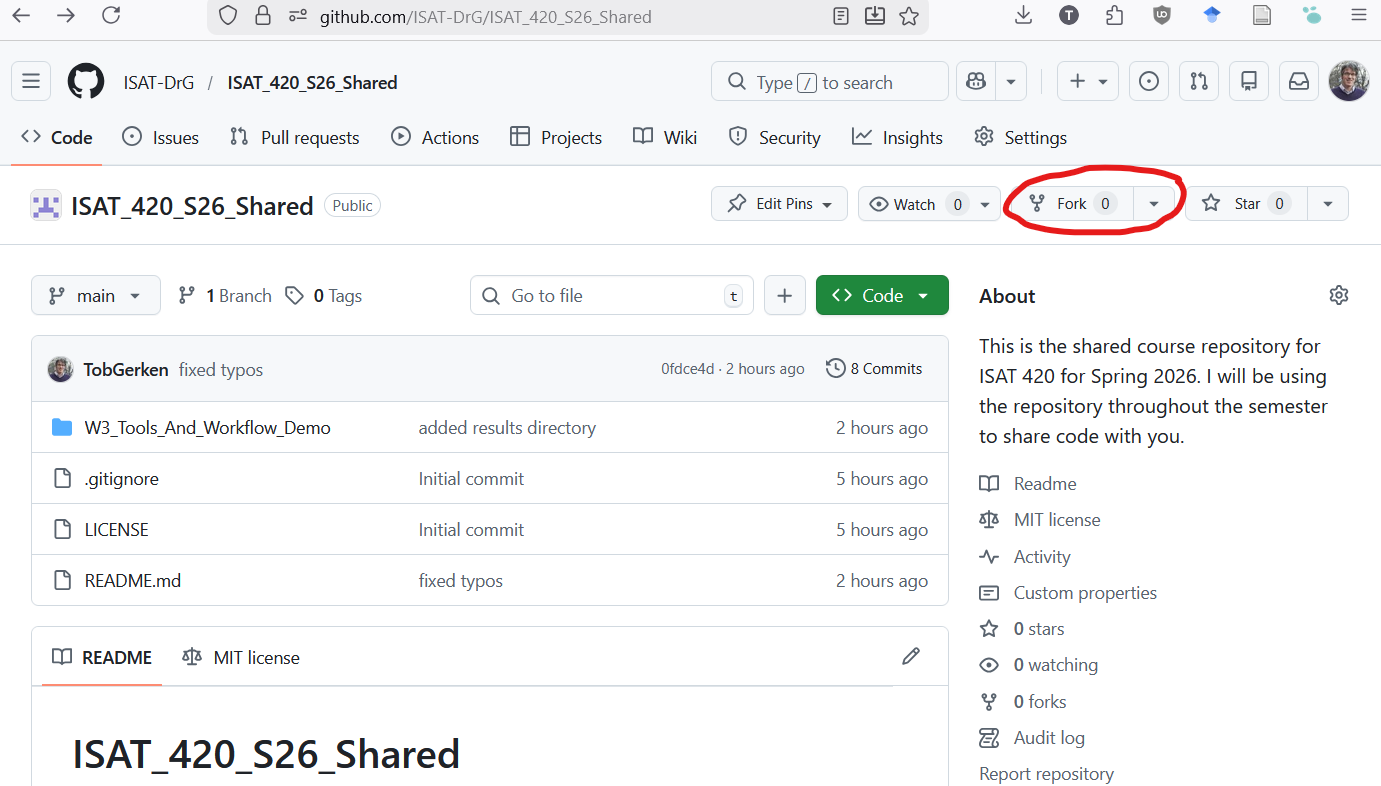
Navigate to the repo that you wish to fork. Example:
https://github.com/ISAT-DrG/ISAT_420_S26_SharedOn the upper right corner you will see a button that says
Fork(Figure 8)![]()
Figure 8: To fork a repo, first navigate to the repo you want to fork. Then click the forkbutton in the upper right hand corner of your screen. You can then create a copy of of this repo in your account.Click on the
Forkbutton and select your user account when it asks you where you want to fork the repo.You can now use GitHub-Desktop to create a local copy of the repository on your computer.
File\(\rightarrow\)Clone Repository- Select the forked repository from the list
- Decide on where you want to save the repository:
Local path - Hit the button:
Clone
Collaborating with Shared Code
Often times, there is a central repository with code that many people are contributing to. This includes many of the Python packages that are part of the Pangeo ecosystem. To manage this collaboration, individual contributors are working on their own forked copies of the project. When they are ready to share (or suggest) a change to the overall project, they can use a Pull Request (Figure 9).
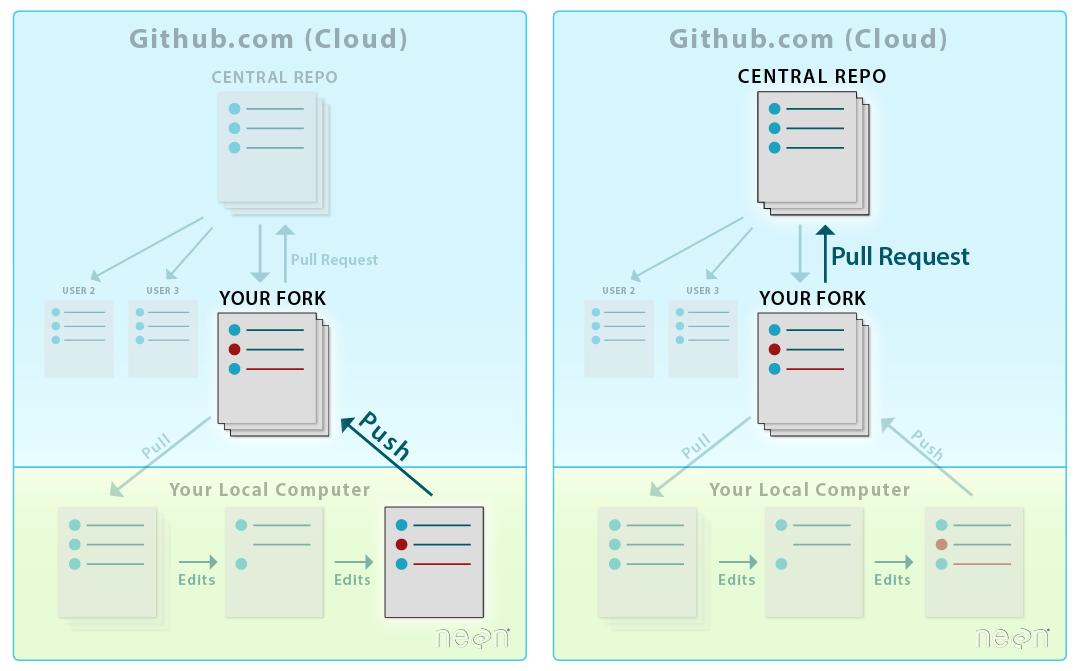
A Pull Request is a workflow that allows
- Your collaborators to see exactly what items where changed line by line
- A group of people to view, review, and comment on the code line by line
- Approve or reject any changes that will then be merged into the base repository.
GitHub Workflow: Creating a Pull Request
For now, we don’t need to know this workflow in detail. However, it is described in Chapter 8, Lesson 2 of the CU-Boulder Intro to Earth Data Science Textbook (2025)