Lab 1: Introduction to Uncertainty and Tolerance
(and creating simple circuits on a breadboard)
Purpose
General
This is the first official lab. In general, the labs have two distinct purposes.
- Concepts: Reinforce and apply concepts from lecture that are important for ensuring high quality measurements and data analysis that can support decision-making.
- Skills: Learn and apply practical skills and tools for building measurement and control systems.
This lab
In this lab you will take measurements of resistors on one DMM and on several different DMMs to investigate tolerance and measurement uncertainty that arises from random and systematic measurement errors. These are important concepts that apply to all measurements.
From a skills perspective, purpose of this lab is to become familiar with some common electronics components such as bread boards, power supplies and resistors and to gain experience using a common electronics measurement tool, the digital multimeter (DMM). You will also construct circuits on a breadboard with series and parallel configurations of resistors. You will then measure various voltage drops across the resistors and compare the measured results to the calculated values.
Learning Goals
The goals of this lab are to
Concepts:
- Review circuit concepts of resistance, voltage and current that you learned in ISAT 152
- Investigate the tolerance of resistors by comparing measured values to the nominal value
- Investigate and quantify the uncertainty in the output of an electronics measurement tool
- Understand the difference between tolerance and uncertainty in measurements
Skills:
- Gain experience using a breadboard, power supply, and digital multimeter
- Gain experience constructing simple circuits on a breadboard
- Measure the behavior of resistors in series vs. parallel to validate Ohm’s Law
- Use computational tools to analyze resistance value statistical data
- Report your findings in a formal lab report
Background
Two important characteristics of the measurement process are tolerance and uncertainty. Any experiment of industrial process has requirements for precision or quality (e.g. how good is good enough). For example, a car manufacturer might specify that gaps between body panels may not exceed 3 mm (i.e. there is a tolerance of 3 mm for the spacing between panels). To check whether requirements are met measurements are needed.
However, both tolerance and uncertainty contribute to variation in the measured value, but they are not the same. Tolerance is an expected deviation from a nominal value; that is, it is a deviation from a stated value that is permitted and its magnitude is known. In general, the word tolerance is applied to a permitted deviation of a manufactured component from some standard (as you learned in ISAT 211); however, it is important to realize that sometimes instrument manufacturers state the accuracy of their measuring instrument as a “tolerance,” which is technically an incorrect use of the term. An example of an expected deviation from a nominal value is the tolerance of a resistor, which is indicated on the resistor by the color of the last band. See the handout at the end of this lab for more details on reading resistor values and tolerance.
Uncertainty in measurement, on the other hand, is much more complex. We will cover uncertainty in more detail later in the course, but for now it is important to understand that uncertainty in a measurement can arise from many sources. Uncertainty can result from systematic errors in the equipment or from errors in the measurement process itself. Uncertainty can also arise from errors in the measurements that are purely random or statistical in nature. Uncertainty arising from equipment is called “instrument uncertainty.” Instrument uncertainty can be due to the calibration process, the inherent resolution of the instrument, hysteresis, sensitivity to disturbance, or inherent instrument inaccuracy. In this lab we are concerned about distinguishing tolerance from the uncertainty of the instrument that we use to measure. To do so, we conduct repeated measurements and then use descriptive statistics to compare the two using the mean of the measurements and their standard deviation, which can be interpreted as the expected variation in measurements due to random variation in the measurement. The standard deviation for a sample is calculated as:
\(s = \sqrt{\frac{\sum_{i=1}^{n}(x_i - \overline{x})^2}{n-1}}\),
where \(x_i\) represents an individual measurement \(i\), \(n\) is the total number of measurements, and \(\overline{x}\) is the arithmetic mean of all measured values.1
The second part of this lab is less about measurement concepts. It is designed to help you construct simple circuits using a breadboard, which is something that you will continue to do throughout the semester. Additionally, we will use this portion of the lab to take some measurements that are designed to verify Ohm’s Law, which describes the relationship between Voltage (\(V\)), Current (\(I\)) and total Resistance (\(R\)) of a circuit:
\(V = I \times R ~ or ~ I = \frac{V}{R} ~ or ~ R = \frac{V}{I}\)
The total resistance depends on whether resistors are in circuit or in parallel and you should probably remember the addition rules from previous classes (or should look them up… )
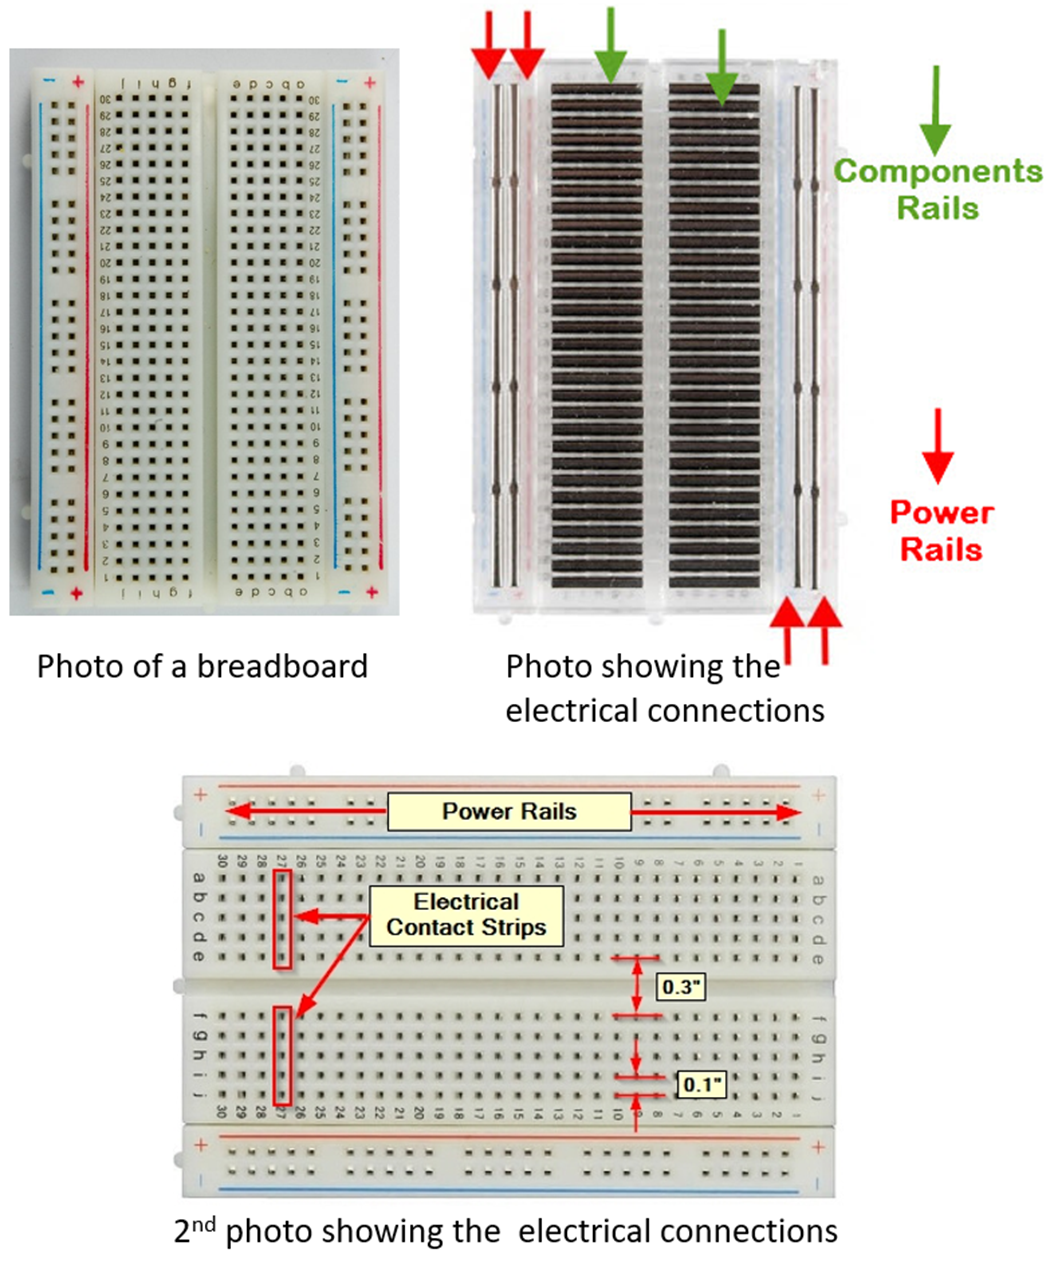
Before you begin this lab, study the breadboard diagram at the end of this handout and compare it to the breadboard at your station. Verify the connections on the breadboard, noting which holes are “connected” by built-in wires and which are not.
Materials
- Breadboard
- Digital multimeter
- Power supply
- Station with ten different digital multimeters
- 30 resistors with the same nominal resistance value
- 1 resistor of a different nominal resistance value
- 3 resistors of nominal resistance values 1.0 kΩ, 2.2 kΩ, 3.3 kΩ (for Part B)
- 4 alligator clip leads (2 red and 2 black)
- Wires
Procedure
A. Measurement of the Resistance of Resistors
Using the resistor value guide (Figure 1) at the end of this lab, obtain the nominal resistance and tolerance of one of the 30 identical resistors at your station. Record the result in your lab notebook. Also draw a picture of the resistor, labeling the color bands and values of the bands. Remember to draw the tolerance band on the right.
Set the DMM to read ohms (Ω). When the DMM is set on Ω, never insert it into a circuit! You need to measure the value of the resistor before putting it into any circuit on the breadboard. Measure the actual resistance of each of 30 resistors, one at a time, to the highest level of precision possible on the DMM. Record all 30 measurements in your lab notebook in an organized table like the one shown below.
ImportantWhen the DMM is set on Ω, never insert it into a circuit!
Resistor Number Measured Resistance (Ω) Deviation (Ω) 1 2 … 30 For each measurement, calculate the amount of deviation above the nominal resistor value (if the measured value is greater than the nominal value), or the amount of deviation below the nominal resistor value (if the measured value is less than the nominal value), and record the result in the appropriate column in the table in your lab notebook. Also report the mean and standard deviation of the measured resistance values.
What is the maximum deviation above the nominal resistor value and the maximum deviation below the nominal resistor value? Looking at the deviation data, do the values fall within the limits of the nominal tolerance indicated by the 4\(^{th}\) band?
Next, using the resistor value guide at the end of this lab, obtain the nominal resistance and tolerance of the one resistor at your station that is different from the rest. Also draw a picture of the resistor in your lab notebook, labeling the color bands and values of the bands. Remember to draw the tolerance band on the right.
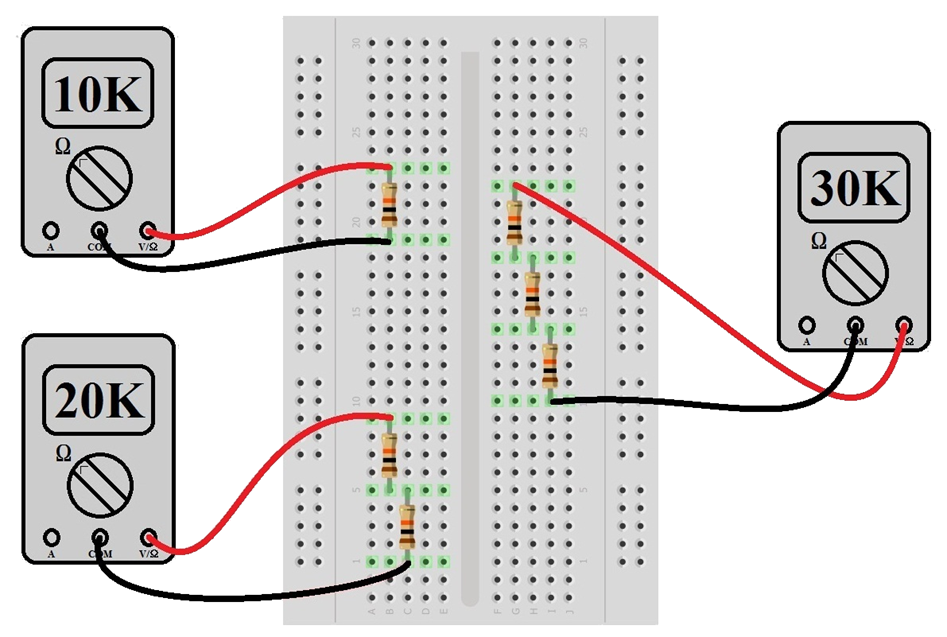
Go to the station with the ten DMMs and measure the resistance of the one resistor to the lowest range possible that does not display OL. (i.e. overload) on the DMM. Record the ten measurements in your lab notebook in a table like the one shown) below
DMM Number Measured Resistance (Ω) 1 2 … 10 Calculate the range over which the measured resistances vary and record the result in your lab notebook.
Calculate the average of the ten resistances on the same resistor as well as the standard deviation and record the results in your lab notebook. How does the average value of the ten measured resistances compare to the nominal value for that resistor?
TipQuestion:The ten measurements of the exact resistor on ten different DMMs represent an example of one specific type of instrument uncertainty, which is not the same as the differences in resistor measurements on ten resistors due to manufacturing tolerance.
Can you understand and explain this difference?
B. Resistors in Series and Parallel on a Breadboard
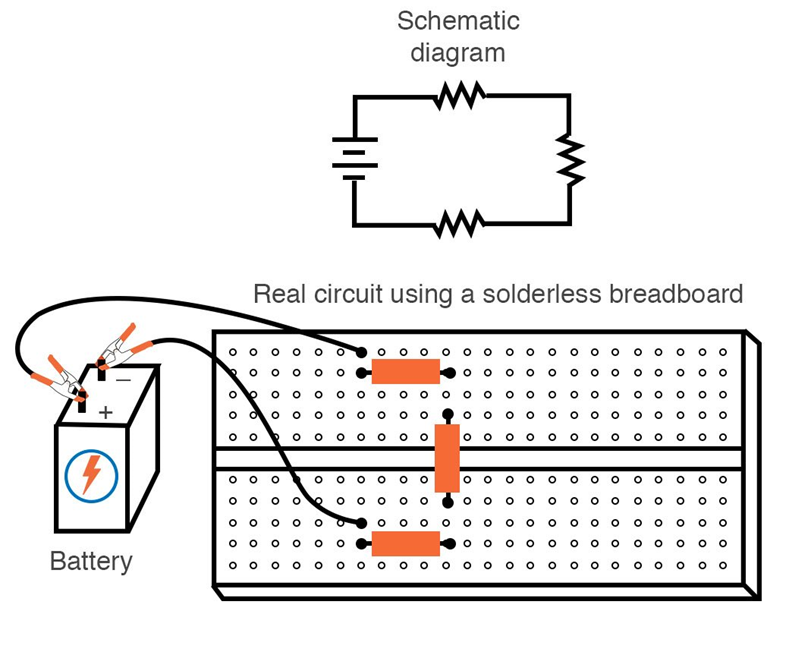
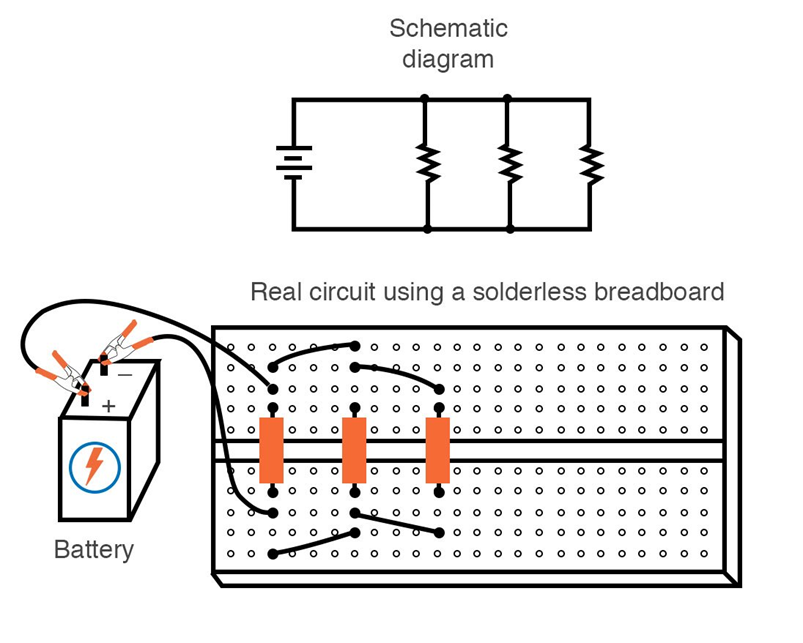
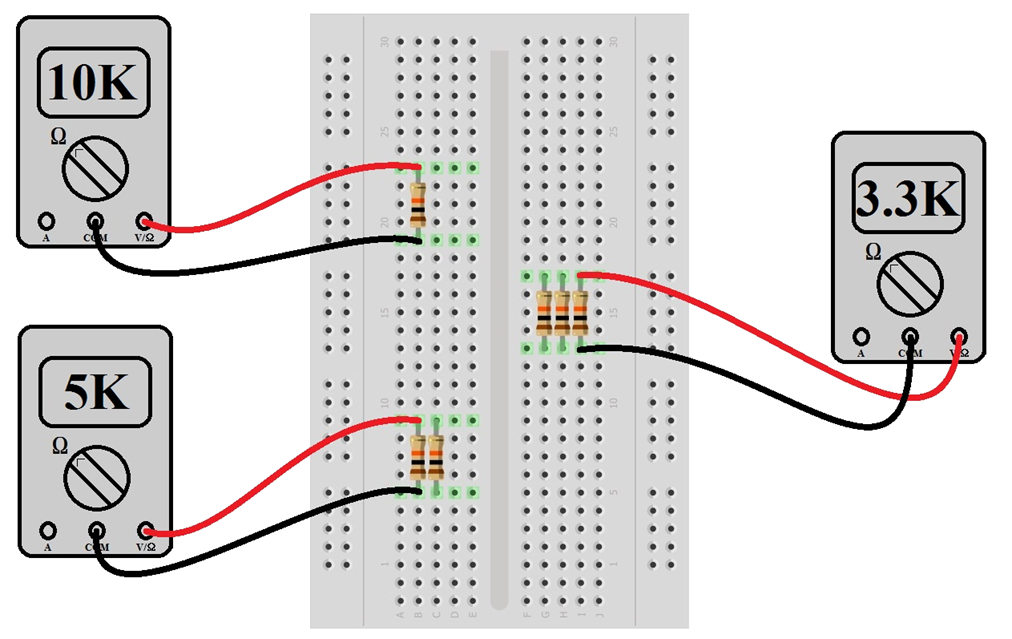
Refer to the illustration of the breadboard and the diagram showing how to connect resistors in series and parallel on a breadboard, which are both at the end of this lab(Figure 3, Figure 4).
Obtain a breadboard, your three resistors of nominal resistance values 1.0 kΩ, 2.2 kΩ, 3.3 kΩ, a power supply, a red and black lead, and a DMM. Confirm the resistance of your three resistors by noting the color bands and recording the information in your lab notebook. Arrange the three resistors in series on the breadboard. Attach a red lead alligator clip to one end of the series resistor setup and a black lead alligator clip to the other end of the series resistor setup. Now plug the red lead into the “+A” of the power supply and plug the black lead into the “-A” of the power supply. Draw a schematic of the setup in your lab notebook including the DMM connections and the power supply and noting the specific resistances of the resistors in your setup.
Note that you now have a complete circuit; that is, when the power supply supplies a potential difference (i.e., a voltage), current will flow around the circuit. Trace the circuit from the power supply red lead, through the resistors on the breadboard, and back through the black lead to the power supply. Verify that there is a connection between all the circuit elements via the breadboard wiring and lead attachments. Draw a picture of your setup in your lab notebook.
Now obtain the other red lead and the other black lead and your DMM. Attach the red alligator clip of this lead to the same end of the series resistor setup as the red alligator clip leading to the power supply, and attach the black alligator clip of this lead to the same end of the series resistor setup that has the black lead leading to the power supply. Be sure the DMM is set to 40V full scale.
You have now wired the DMM to read the voltage across the total resistance of the three resistors in series. Add the DMM to the drawing in your lab notebook.
ImportantYou must now get one of your instructors to sign off on your setup.
Turn on the power supply and gradually turn up the power supply voltage to 12.0 V. Be sure to carefully read the divisions on the power supply so that you are supplying 12.0 V. Now look at the DMM. What is the DMM displaying for the voltage across the three resistors in series? It may not be exactly 12.0 V. Can you think of a reason why the DMM is not displaying exactly 12.0 V compared to what the power supply indicates? The DMM voltage reading represents the actual voltage “drop” across the three resistors in series. Record this reading in your lab notebook.
Turn down the power supply and then turn it off. Now disconnect the alligator clip of the black lead front the DMM and attach it to the other end of the same resistor that has the red alligator clip from the DMM. Now you have connected the DMM to measure the voltage drop across that one, single resistor.
Turn on the power supply and, once again, gradually turn up the power supply voltage to 12.0V. What is the voltage reading of the DMM now? This voltage reading represents the voltage “drop” across that single resistor. Record this reading in your lab notebook. Disconnect the DMM leads and connect them to one of the other resistors. Record that reading in your lab notebook. Do the same thing for the third resistor and record that reading in your lab notebook. Do these resistor voltage drops agree with what you know about how voltage drops across one resistor in a series resistor setup?
Turn down the power supply and turn it off. Disconnect the DMM, the power supply, and the three resistors. Reconnect the three resistors on the breadboard in parallel. You can refer to the diagram at the end of this lab that shows how to connect resistors in parallel on a breadboard. You may want to connect an auxiliary wire to each side of the parallel setup so that you can easily connect the power supply and the DMM in parallel. Draw a schematic of the setup in your lab notebook including the DMM connections and the power supply and noting the specific resistances of the resistors in your setup.
Now attach the red lead alligator clip of the power supply to one side of the parallel resistor setup and attach the black lead alligator clip of the power supply to the other side of the parallel resistor setup. Then attach the red lead alligator clip of the DMM to the parallel resistor setup on the same side as the red lead of the power supply and attach the black lead alligator clip of the DMM to the parallel resistor setup on the same side as the black lead of the power supply. You have now wired the DMM to read the equivalent resistance of the three resistors in parallel. Draw a picture of your setup in your lab notebook.
Turn on the power supply and gradually turn up the power supply voltage to 12.0V. Now look at the DMM. What is the DMM displaying for the voltage drop across the three resistors? The DMM voltage reading represents the actual voltage “drop” across the three resistors in parallel. Record this reading in your lab notebook.
Turn down the power supply and then turn it off. Now disconnect the alligator clips of the red and black leads from the DMM and re-attach the red clip to one resistor on the positive side of the circuit and the black clip to the same resistor on the negative side of the circuit. Now you have connected the DMM to measure the voltage drop across that one, single resistor.
Turn on the power supply and gradually turn up the voltage to 12.0V. What is the voltage reading of the DMM now? This voltage reading represents the voltage “drop” across that single resistor. Record this reading in your lab notebook. Does this reading agree with what you know about how voltage drops across one resistor in a parallel resistor setup? Repeat this measurement for the other two resistors and record the readings in your lab notebook.
Disassemble your breadboard, organize the lab materials, and clean up the area for the next class. Verify your lab notebook data with your partners and have your instructor sign your lab notebook.
C. Analyzing the Data
In analyzing the data this lab, you should go through all the places in that lab where it asks you questions (you should highlight or underline them in your handout). Those questions are meant to emphasize an important concept you should examine as you analyze the data and then address that concept in your lab write-up.
As you do the Results sections of your lab report, the order of the results should present the order of the lab exercise.
Every time you present an experiment that you did, you should present the measurement results and then address the concept presented in the question. Please do not copy the questions verbatim and put them in your report. The questions are meant to trigger you to think about an important point regarding the measurement results and to address that point in your analysis.
Include the following items into your Results:
- The completed tables for parts A and B.
- Make a histogram of the 30 measured resistances. Be sure to make the bin sizes of your histogram reasonable and logical. Describe where do the measured values tend to cluster?
It is strongly suggested to use Python and Google Collab for the data analysis. I have prepared a jupyter notebook to help you get started. It is found here: Lab1_ResistorAnalysis
Be sure that when you do the Analysis for Part B, that you tie your voltage readings for the three resistors in parallel and series to Ohm’s Law (\(V = IR\)); that is, you must clearly show mathematically and discuss how the voltages that your obtained validate Ohm’s Law for combining resistors.
Deliverables
You should submit a formal lab report. Your lab report should be typed using professional language and contain the following section:
- Cover Page
- Abstract
- Introduction
- Methods
- Results
- Discussion
- Conclusion
- References
Review the How to Write an Excellent Lab Report guide and the Lab Report Rubric before starting.
- Introduction:
- Define (with literature or lecture reference) certain important vocabulary including uncertainty, tolerance,
- Introduce and explain Ohm’s Law and relate it to the Lab
- Results:
- It is not enough to just paste Figures and Tables into the results section.
- In addition to the the tables and figures, report the main statistics including their uncertainty (as standard deviation).
- Make sure to summarize the information from tables and figures in written text that is included in the results section. For example: “Figure 1 shows …”
- Discussion:
- Make sure to make use of your own data in the results, when discussing the questions. Avoid generic statements that you could write without having seen the data.
- Here are some items to start your discussion:
- Compare the magnitude of random and systematic (from the DMM) variation in your measurements.
- What is the main source of variation.
- Do the resistors meet the specifications given?
- What are potential sources of error in your results?
- How certain can you be from the measurements?
- Discuss the relevance of your results and the covered concepts to measurements and applications in general.
Acknowledgements
Special Thanks for Dr. Anne Henriksen (ISAT Emeriti) for developing this lab with Joe Rudmin who also provided preliminary data. Thanks also to Dr. Ken Lewis and Dr. Emil Salib for their helpful comments, and to those who developed earlier versions of this lab: Dr. Joe Blandino and Dr. Maria Papadakis. Thank you to Dr. Chris Bachman for updating and testing the lab.
Acknowledgements
Special Thanks for Chris Bachman for putting together the Appendixes.
Appendix 1 Resistors
Function
Resistors restrict the flow of electric current; for example, a resistor is placed in series with a light-emitting diode (LED) to achieve a certain specific current passing through the LED. Resistance is measured in ohms, and the symbol for ohm is an omega (Ω). One Ω is very small, so resistor values are often given in kΩ or MΩ: 1 kΩ = 1000 Ω and 1 MΩ = 1000000 = 106 Ω).
Resistors are indicated in circuit diagrams as:

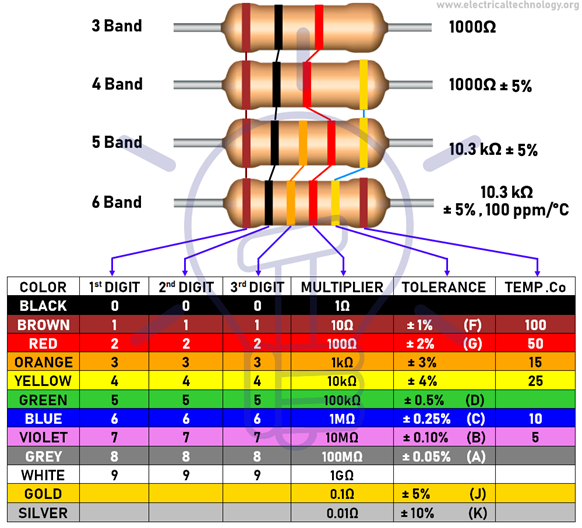
Resistor values - the resistor color code
Resistor values are normally shown using colored bands. Each color represents a number as shown in the table. Most resistors have four bands:
The first band gives the first digit of the resistance.
The second band gives the second digit of the resistance.
The third band indicates the number of zeros after the 2nd digit.
The fourth band is used to show the tolerance of the resistor; that is, the ±% deviation from the nominal value of the resistor.
If there are five bands, then the first three bands give the first, second and third digits, the fourth band gives the number of zeros after the third digit, and the fifth band gives the tolerance of the resistor.
Examples of different resistors with different numbers of bands and color chart for decoding resistor values (note the multiplier can be either in the 3rd or 4th position)
Appendix 2: Breadboard Basics
We will use these in several labs.
Resistors in Series
Resistors in Parallel
History
| Revision | Description | Author |
|---|---|---|
| 2026-01-17 (S26) | Maintenance modifications | Tobias Gerken |
| 2025-01-24 (S25) | Update of analysis and deliverables | Tobias Gerken |
| 2024-01-16 (S24) | Updated to Web and Deliverable Tips | Tobias Gerken |
| Initial Word Version | Tobias Gerken | |
| PDF Version |
Footnotes
There are two different equations for the standard deviation. One is for the sample standard deviation (\(s\)), the other is for the standard deviation of a population (\(\sigma\)). Which one to use when is a bit confusing. In our case the sample standard deviation makes more sense, since you are not sampling all 1000 \(\Omega\) resistors that exist.↩︎