Lab 5: Week 1 - LED Temperature Alert System
… and understanding our code
Purpose
The purpose of this laboratory exercise is to further our understanding of controlling sensors with a computer and using the computer for data acquisition, processing, and control of physical systems.
In this lab you will use thermocouple to measure and record temperature under the control of a Raspberry Pi computer interfaced through the General Purpose Input and Output (GPIO) pins. You will construct the circuit on a breadboard and write a Python script to control the sensor and record data locally. Then, you will connect to the JMU WiFi and construct additional Python code to write data to the cloud where it can be accessed by any device at any time. This will require several cyber security authentication protocols. Finally, you will use the thermocouple sensing system to activate an LED if a critical temperature is reached and send an alert to your cell phone via SMS text messaging.
Learning Goals
The goals of this Lab (all weeks together) are to:
- Review circuit concepts to physically connect measurement hardware to a computer
- Gain experience with General Purpose Input and Output pins (GPIO)
- Become familiar with Python programming used to control sensors and physical systems
- Investigate and evaluate measurement capabilities of a measurement instrument
- Calibrate the instrument
- Control sampling rate
- Write data to a local host computer
- Calibrate the instrument (and estimate Type B calibration error)
- Determine an estimate of Type A (random) measurement uncertainty
- Write data to the Cloud
- Use real-time automated decision making to control physical systems based on incoming data
- Send alerts wirelessly via WiFi and SMS communication protocols
- Report your findings in a formal lab report
This weeks objectives are in bold.
In this part of the thermocouple lab you will add to your Python script to record data locally. Just as we did in Labs 3 and 4, you will create a .csv file to record you data. You will then be able to calibrate your thermocouple setup with boiling water and ice water. Finally, you will use the thermocouple sensing system to activate an LED if a critical temperature is reached (either too hot or too cold).
Background
Thermocouples are an essential part of many industrial processes and temperature control systems. They need to be calibrated regularly to ensure proper operation. In this second part of the lab, you will add code to your Python script to record data locally on the RPi. This will be used to facilitate calibrating the thermocouple using a two-point calibration of boiling water (100oC) and ice water (0oC). Additional lines of code will be needed if the thermocouple is not outputting the correct temperature. Finally, you will add lines of code to your Python script to send a warning message and activate an LED indicator if the temperature becomes too high or too low – thus simulating physical control systems used in industrial processes and thermal regulation.
Methods
It it is good practice to
- create a dedicated folder for your work, where you save all files that belong to a given project. This means e.g. a folder for ISAT300 that contains a subfolder for each lab.
- save all files to disk with sensible names
- use typical file extensions, such as
<filename>.pyfor Python files.
This lab assumes that you have a working Python program from Lab 3 to conduct thermocouple measurements.
If you no longer have that program, download the Lab 3 starter code.
Add one more line of code convert the temperature from Celsius to Fahrenheit and print this value on the screen.
print(str(temperature * 9 / 5 + 32), "F")Methods: Writing Data to a .CSV file
Comma-separated Variables (or .csv) files can be opened by numerous software packages to perform data analysis. Last time we used f.write to add data to our file. This time, we will write two variables (Celsius and Fahrenheit) to the file using a formatted python string.
In order to create a calibration curve and assess measurement uncertainty (Type A: random and Type B: systematic) for the thermocouple you will need to collect data.
This week, we are doing it in a slightly different way to Lab 3. Compare the two.
What are the differences?
We are using with open(...) instead of opening a file f with f = open(...) to access our data file. They do the same thing, but are slightly different. The command with open(...) will automatically close the file when it is not needed; f = open(...) requires an additional statement f.close() to close the file object f.
Replace the code for writing temperature to file with the following Python code to create a .csv file.
Then write the thermocouple temperature measurements to it.
Embed the code in the for-loop so that the data is simultaneously presented on-screen and written to the .csv file.
Tip- Find out which line of your code represents the actual temperature measurement.
- Think about the placement of that line inside the code, when you want to run multiple measurements.
- Assign your measurement to a variable before doing the temperature conversion.
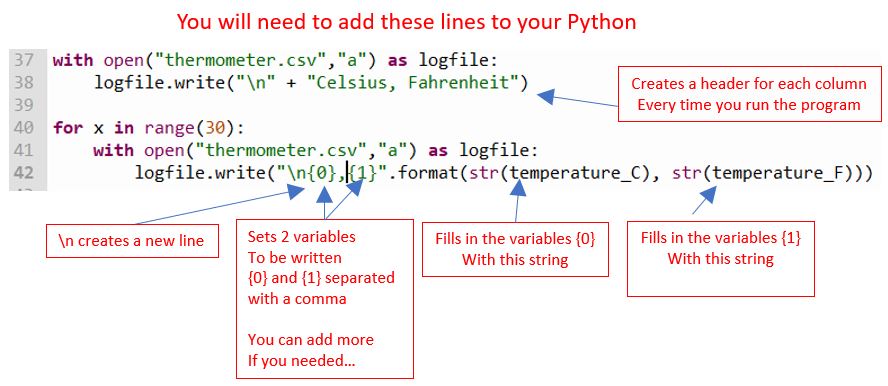
Code to write your data to a file ImportantTest the system after you have added these lines of code be sure you are creating a data file with 30 samples!
Once your code is working, use your program to generate the data that allows you to create a two-point calibration curve using 0oC and 100oC reference temperatures.
Use the collected data to:
- calculate mean \(\pm\) standard deviation for each reference temperature
- determine slope and offset of your temperature calibration curve.
Add lines of code to your script to correct the temperature output based on the slope and offset of the two-point calibration curve.
Methods: Hardware connection – Physical connection for the LED
Connect the LED to the RPi as shown in the diagram below. Use different locations on the breadboard to accommodate the thermocouple sensor, as needed. GPIO pinout is provided below for reference.
ImportantShut down the RPi before making the connection and ask an instructor to get the wiring checked before turning it back on!
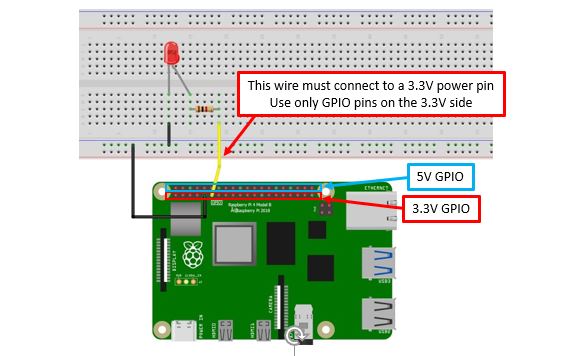
Wiring diagram to connect the LED to the RPi for automated control 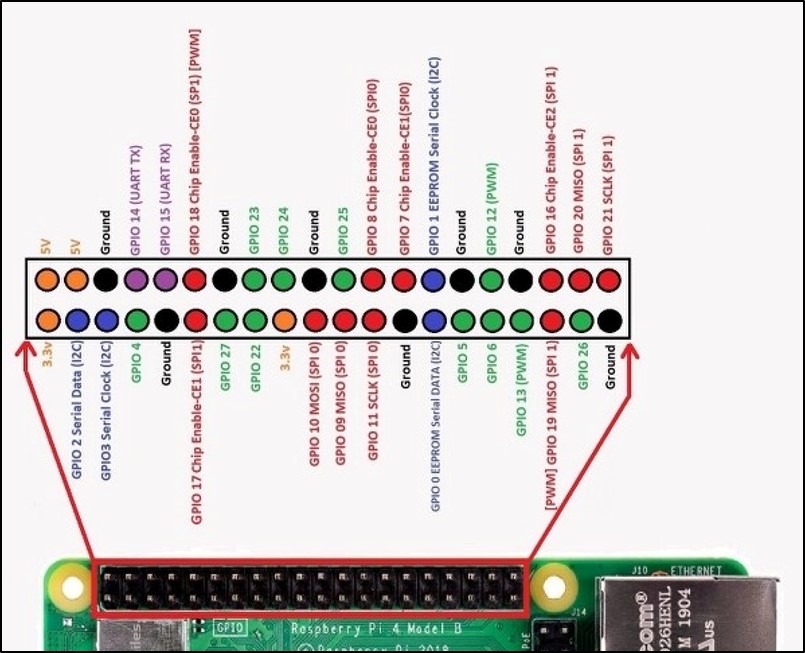
GPIO Overview
Methods: Software connection to write data to .csv file and activate the LED
You will need to add a few new lines of code to the Python script you are using to interface with the thermocouple to write data to a .csv file and to activate the LED when a critical temperature is reached. Do this after you have finished your measurements for the calibration.
Open the thermocouple Python code in Thonny and add the following lines of code in the appropriate locations within the program. Control the LED so that the light is normally OFF, but turns ON (and stays on) below 15oC or above 80oC. Make sure the LED turns OFF if temp is between 15-80oC.
- Add the lines of code on the right to enable the GPIO and setup the LED connection
You will determine the correct locations within the Python program to put them
import RPi.GPIO as GPIO
GPIO.setmode(GPIO.BCM)
GPIO_LED = (17)
GPIO.setup(GPIO_LED, GPIO.OUT)- Add the below lines of code to set the temperatures which activate the LED. Embed them in the loop so they are applied to every measurement
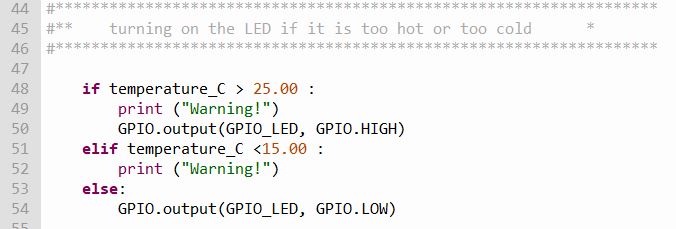
Since we have two conditions to check (too hot or too cold) we will use the elif statement. This stands for else if. If the first criteria is not met (> 25.00), it will check the next criteria (<15.00). You can add as many of these as you like. The else statement at the end provides the default setting if none of the other criteria are met.
- Final Step: Add a second, different color LED to the circuit. Modify the Python code to turn one LED on if the temperature is too hot, and turn the other LED on if it is too cold. Neither LED should be on at room temperature.
Acknowledgements
This Lab was prepared by Dr. Chris Bachmann. Special thanks to Joe Rudmin for obtaining necessary supplies and facilitating the lab setup.
| Revision | Description | Author |
|---|---|---|
| 2025-02-28 | Updated to account for thermocouple lab 3 | Tobias Gerken |
| 2024-03-01 | Updates for clarity and error fixes | Tobias Gerken |
| 2024-02-23 (S24) | Updated to Web, changes to sample code and images | Tobias Gerken |
| Initial Version | Chris Bachmann |