How to Write an Excellent Lab Report
Purpose
Even in the age of computer animation, short-form video, etc. written reports remain one of the most important tools for communicating information effectively. This is why businesses and research rely on them or related formats (like scientific articles). Reports allow you to include all the information that a reader needs in one convenient place – if and only if they are well crafted. Doing this is a good skill to learn that needs practice.
The written format that includes figures and tables allows the reader to quickly find what they need and then digest the information in more depth. This is why having a consistent and logical structure is key for an excellent lab report.
Increasingly, tools like Jupyter notebooks, R-markdown, or Quarto (the tool I used to create this lab manual) are applied to integrate data analysis and figure generation into reports. This ensures that data analysis is transparent and that reports can easily be updated when needed.
Learning Goals
After reading this page, you should
- know the components and structure of the lab report.
- be able to compose lab reports for the ISAT 300 labs.
- know the grading requirements for your group’s lab reports.
Lab Report Structure
The below section is based on the Writing Lab Reports 1 guide by Indiana University Bloomington Libraries.]
Hint: Because you are likely writing your lab report as a team by dividing up sections, you should think about the time-sequence of writing.
For example:
- The abstract needs to be written last because it contains a summary of all other sections.
- The discussion section needs to use the numeric and qualitative results from the results section to put these into context and to discuss how results relate to the overarching lab goals etc.
This means that you need to think about group-internal due dates when diving up the work.
A complete lab report contains the following components:
Cover Page with Title
- The title of the lab report should be descriptive of the experiment and reflect what the experiment analyzed.
- Ex: “Determining the Free Chlorine Content of Pool Water”
Abstract
- Abstracts are a summary of the experiment as a whole and should familiarize the reader with the purpose of the research.
- Abstracts will always be written last, even though they are the first paragraph of a lab report.
- When writing an abstract, try to answer these questions:
- Why was the research done or experiment conducted?
- What problem is being addressed?
- What methods were used?
- What results were found?
- What are the meaning of the results?
- How is the problem better understood now than before, if at all?
Introduction
- The introduction of a lab report discusses the problem being studied and other theory that is relevant to understanding the findings.
- Include and explain the concepts from the lecture that are applied in the lab
- Include and explain the equations that you will be examining in the lab
- Provide background on the topic of the lab and include real-world examples (if possible).
- The hypothesis of the experiment and the motivation for the research are stated in this section.
- The motivation of the research should be framed about the topic of the lab and not about you. For example, do not write that the motivation of the lab is for you to gain certain skills.
- Write the introduction in your own words. Try not to copy from a lab manual or other guidelines. Instead, show comprehension of the experiment by briefly explaining the problem.
Methods
- The methods and materials section provides an overview of any equipment, apparatus, or other substances used in the experiment, as well as the steps taken during the experiment. If using any specific amounts of materials, make sure the amount is listed.
- Write this as a paragraph. Do not include a list of materials.
- Example: > We used a pipette to add an aqueous solution containing 1.13mg of Na and 0.67mg Ag per 200 mL of water to graduated cylinder containing …
- List the steps taken as they actually happened during the experiment, not as they were supposed to happen.
- Explain how your experimental data was analyzed and include relevant equations
- If written correctly, another researcher should be able to duplicate the experiment and get the same or very similar results.
Results
The results sections shows and describes the data that was collected or found during the experiment.
Your results section should start with a brief introductory paragraph or sentence that highlights the motivation of the experiment.
Include the data collected (as a Table) and any statistics that are calculated. If the data is too large to display as a Table, include a Table with its statistics.
Use graphs, charts, or other figures to show your results.
- Tables should be labeled numerically, as “Table 1”, “Table 2”, etc. and have a Table header inserted above the table.
- Other figures should be labeled numerically as “Figure 1”, “Figure 2”, etc. and should have a descriptive figure caption below the figure.
- Figures formatting should be clear and include labels for x and y axes as well figure legend if more than one type of data is being presented.
Your results must always include information about uncertainty.
In addition to Figures and Tables, you must describe the results and data in full sentences and paragraphs. This includes stating key numeric results within the text.
Provide Reference any graphs and tables within the text (see example below): > Class results from the heart rate lab show that measured resting heat rates ranged between 44 and 103 beats per minute (bpm) with most resting heart rates in the order of 68-73 bpm (Figure 1). The variation of heat rates between individuals was generally larger than the variation in repeated heart rate measurements for the same person (Table 1). <… More description>
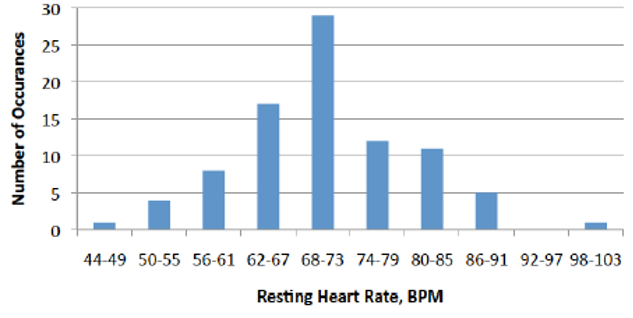
Figure 1: Distribution of measured resting heart rates in beats per minute (BPM) collected in Fall 2022 Table 1: Resting heart rates measured in beats per minute (BPM) for individual subjects collected in Fall 2022 with three repetitions and calculated average resting heart rate Test subject identifier Resting Heart Rate, 1st sample (bpm) Resting Heart Rate, 2nd sample (bpm) Resting Heart Rate, 3rd sample (bpm) Average Resting Heart Rate (bpm) 001 67 75 70 71 … … … … … xxx 70 74 81 75 If your the lab contains more than one experiment, make sure to present results in a consistent order.
Discussion
- The discussion section is one of the most important parts of the lab report. It analyzes the results of the experiment and is a discussion of the data. Therefore it must be written after the results section is completed and everyone in the group has a shared understanding of what these results highlight.
- Make sure to discuss the results of your experiments and refer to the specific results.
- Go through the results figure by figure (with reference to the specific figure or data) and discuss how these results relate to the concepts that lab is about.
- Avoid general statements that could be written without having conducted the experiment.
- If any results are unexpected, explain why they are unexpected and how they did or did not effect the data obtained.
- Analyze the strengths and weaknesses of the design of the experiment and compare your results to other similar experiments.
- What role does the experimental error play for trusting these results.
- Explain your results and discuss them using relevant terms and theories.
- When writing a discussion, try to answer these questions:
- What do the results indicate?
- What is the significance of the results?
- Are there any gaps in knowledge?
- Are there any new questions that have been raised?
Conclusion
- The conclusion is a summation of the experiment. It should clearly and concisely state what was learned and its importance.
- Talk about what the results and discussion revealed about the processes and the system you are investigating.
- Do not talk about the technical skills you learned.
- If there is future work that needs to be done, it can be explained in the conclusion.
References
- If using any outside sources to support a claim or explain background information, those sources must be cited in the references section of the lab report.
- Use a numeric citation format such as the IEEE Numeric Style.
- In this style 2 citations are numbered in the order of appearance. Each citation should be enclosed in square brackets. Once a source has been cited the same number is re-used for all subsequent citations.
- A reference (see end of this document) list at the end of the document lists the full details of the sources, including the data accessed for websites.
- It is always a good idea to cite the lab manual 3 and the textbook 4
Incorporation of past feedback
A 15% portion of your lab report, will be assigned based on incorporation of feedback from the previous labs. To get these points you must:
- Incorporate feedback from the last report into your work. Do not repeat the same errors!
- Provide a brief paragraph at the end of your report that cites specific feedback from the previous report and what you have done differently in response to this feedback.
Rubric
Lab reports will be graded using a rubric.
Footnotes
Indiana University Bloomington Libraries, How to Write a Lab Report[Online]. Available: https://guides.libraries.indiana.edu/c.php?g=992698&p=7182656, Accessed online: 2025-01-21↩︎
Bath University Library, IEEE Referencing Style Sheet [Online]. Available: https://www.bath.ac.uk/publications/library-guides-to-citing-referencing/attachments/ieee-style-guide.pdf, Accessed online: 2025-01-21↩︎
ISAT 300 Faculty, Title of Lab [Online]. Available: Canvas URL, Accessed online: Date ↩︎
Illowsky B., Dean S., Introductory Statistics, 2022 ed, Houston: OpenStax (2022)↩︎