ISAT 300 Semester Project
Measuring the Temperature of Harrisonburg and Examining Historical Data
Purpose
At its core, ISAT 300 is about, how we use data for informed decision making (@fig_decision_making):
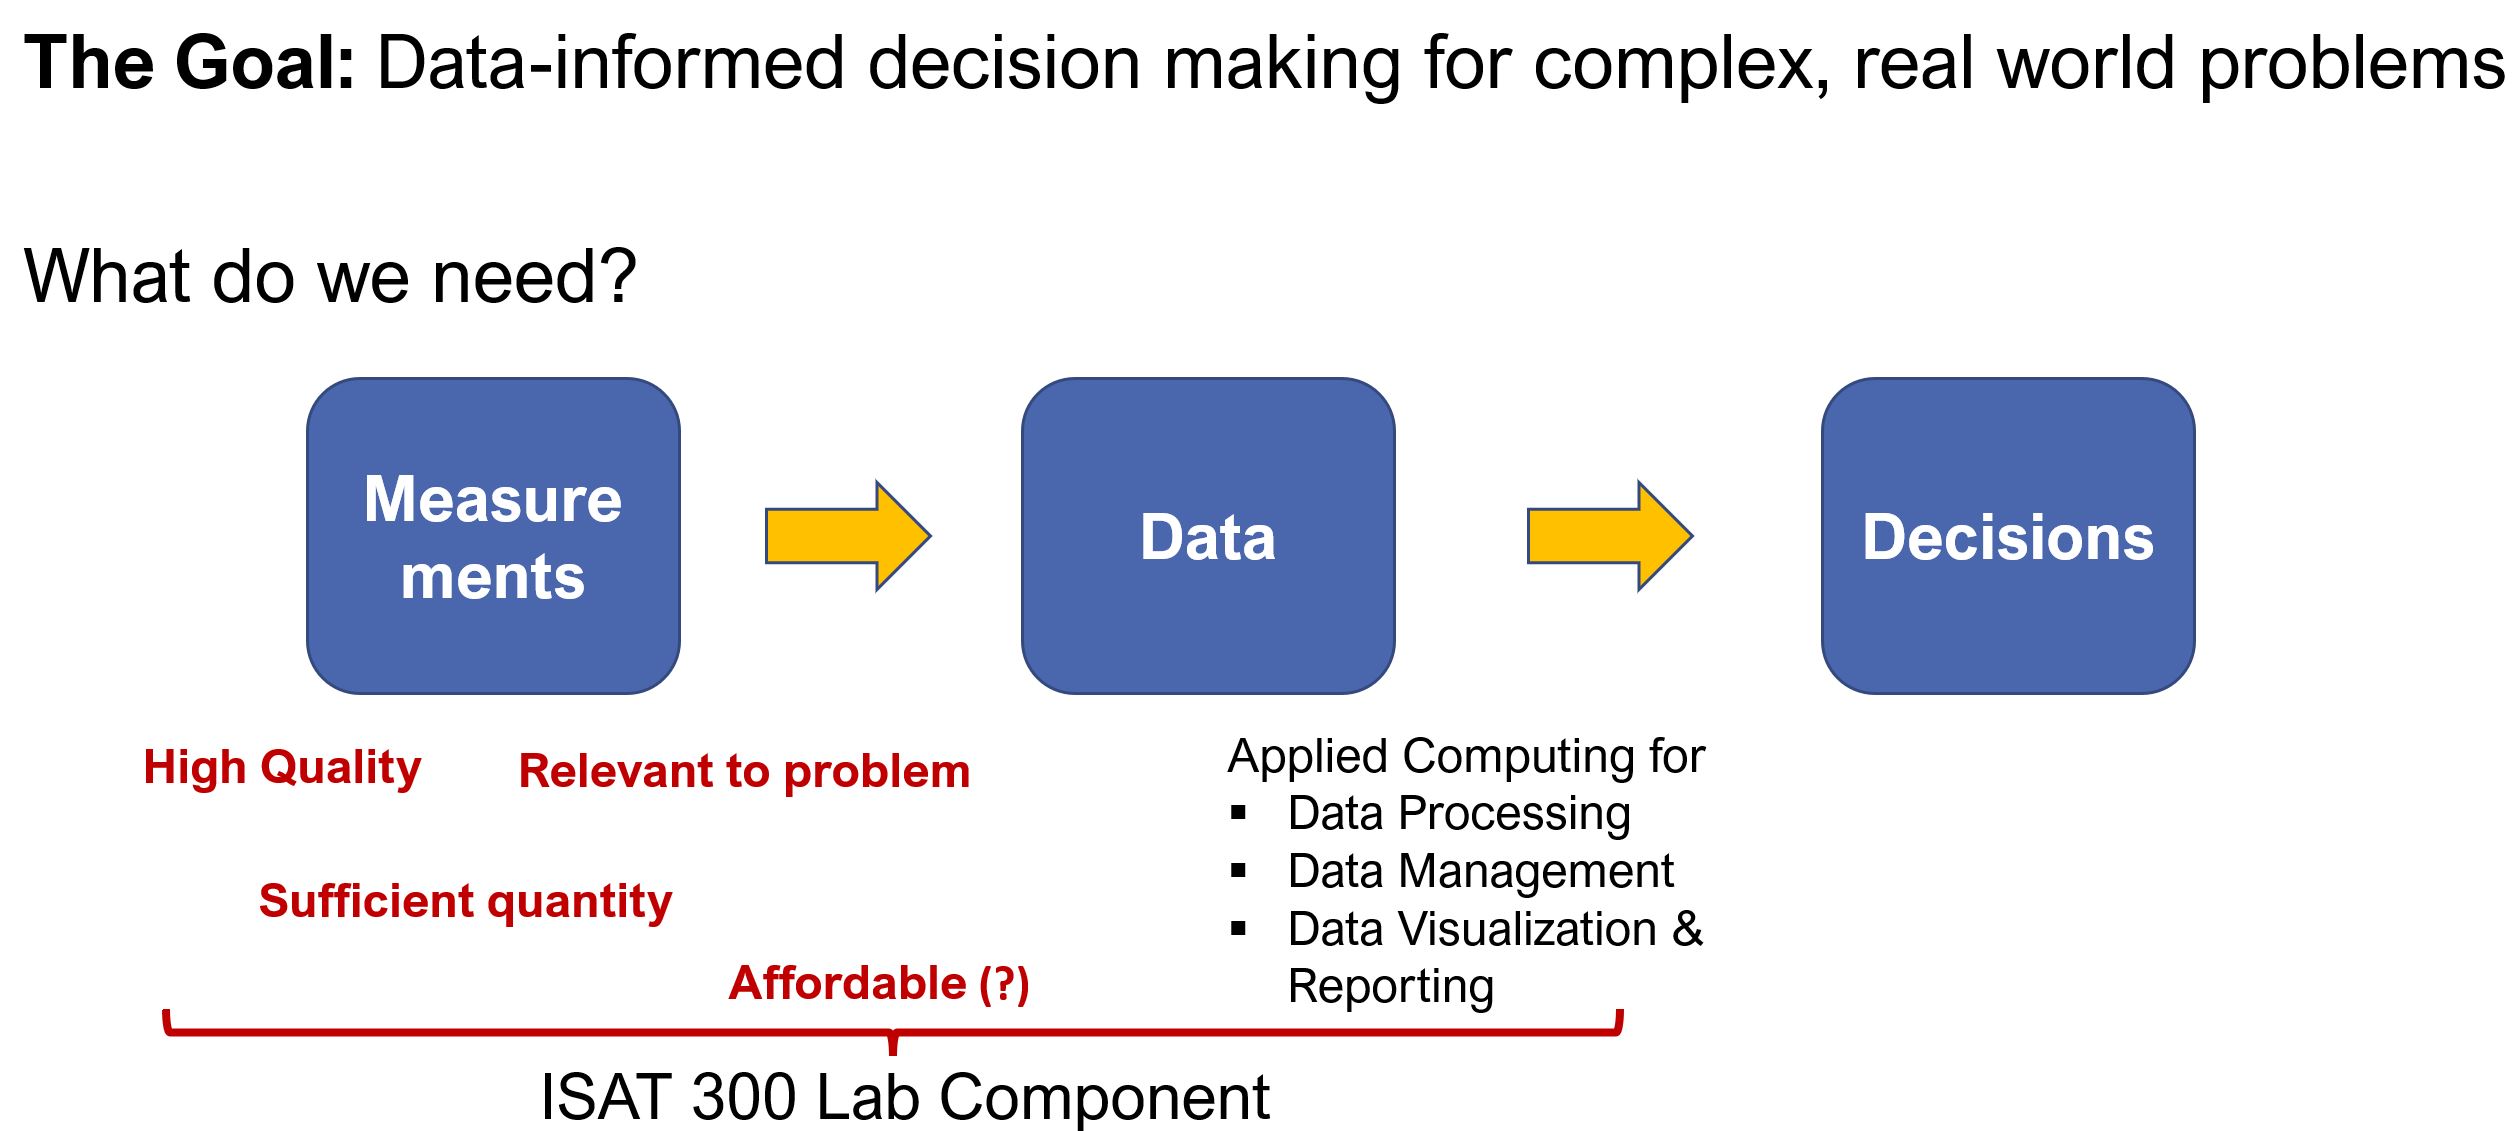
Over the course of the six lab experiments, you have applied fundamental measurement concepts during the collection and analysis of data.
The purpose of this laboratory exercise is to further our understanding of these fundamental measurement concepts, data acquisition, and data analysis techniques. These concepts are broadly applicable in many different arenas, but we will be focusing on ambient temperature measurements and discussing how they relate to global temperature measurements and the challenge of climate change.
Learning Goals
The goals of this project are to:
- Investigate and evaluate challenges and opportunities for measuring ambient temperature
- Understand how to setup and deploy a remote data logging instrument
- Be able to retrieve, analyze, and present data from a remote logging instrument across a range of platforms
- Describe the uncertainty associated with individual and multi-source temperature measurements for a given region
- Recognize how data acquisition has changed over time, specifically for global temperature measurements
- Acquire and analyze historical data from trusted sources to draw your own conclusions
- Report your findings in a formal lab report
Background
Global climate change has been described as the most challenging problem facing society. The Intergovernmental Panel on Climate Change (IPCC) was established in 1988 by the World Meteorological Organization and the United Nations to provide scientific assessments of climate change (who continue to provide funding for it). The IPCC has become the leading authority on Climate Change and provides broad public policy recommendations. It does not conduct independent research; instead, it conducts systematic reviews of relevant published data from the scientific community.
Since the First Assessment Report that was completed in 1990 and that predicted a rise of 0.3 \(^\circ\)C rise in global temperature per decade during the 21st century, the reports have become more comprehensive and have been increasingly focusing on the effects of warming and other global changes on humans and ecosystems alike.
The Fifth Assessment Report was completed in 2014. This report concludes that atmospheric CO2 concentrations increased to their highest levels of the past 800,000 years and that this will result in severe, pervasive, and irreversible impacts. Mean global temperatures will increase by 3.7 to 4.8 \(^\circ\)C by the year 2100. Mitigation strategies pledged in the Cancun agreements are likely (66-100%) to keep global temperature rise below 3 \(^\circ\)C.
The Sixth Assessment Report was completed in 2023. Results conclude that human-caused climate warming is certain and that limiting warming to below 1.5 \(^\circ\)C requires a 50% reduction in global climate warming gas emissions by 2050.
The 5th U.S. National Climate Assessment, published in 2023 by the U.S. Climate Research Program, summarizes climate change impacts, risks, and responses for the U.S.
The 5th National Climate Assessment concludes that:
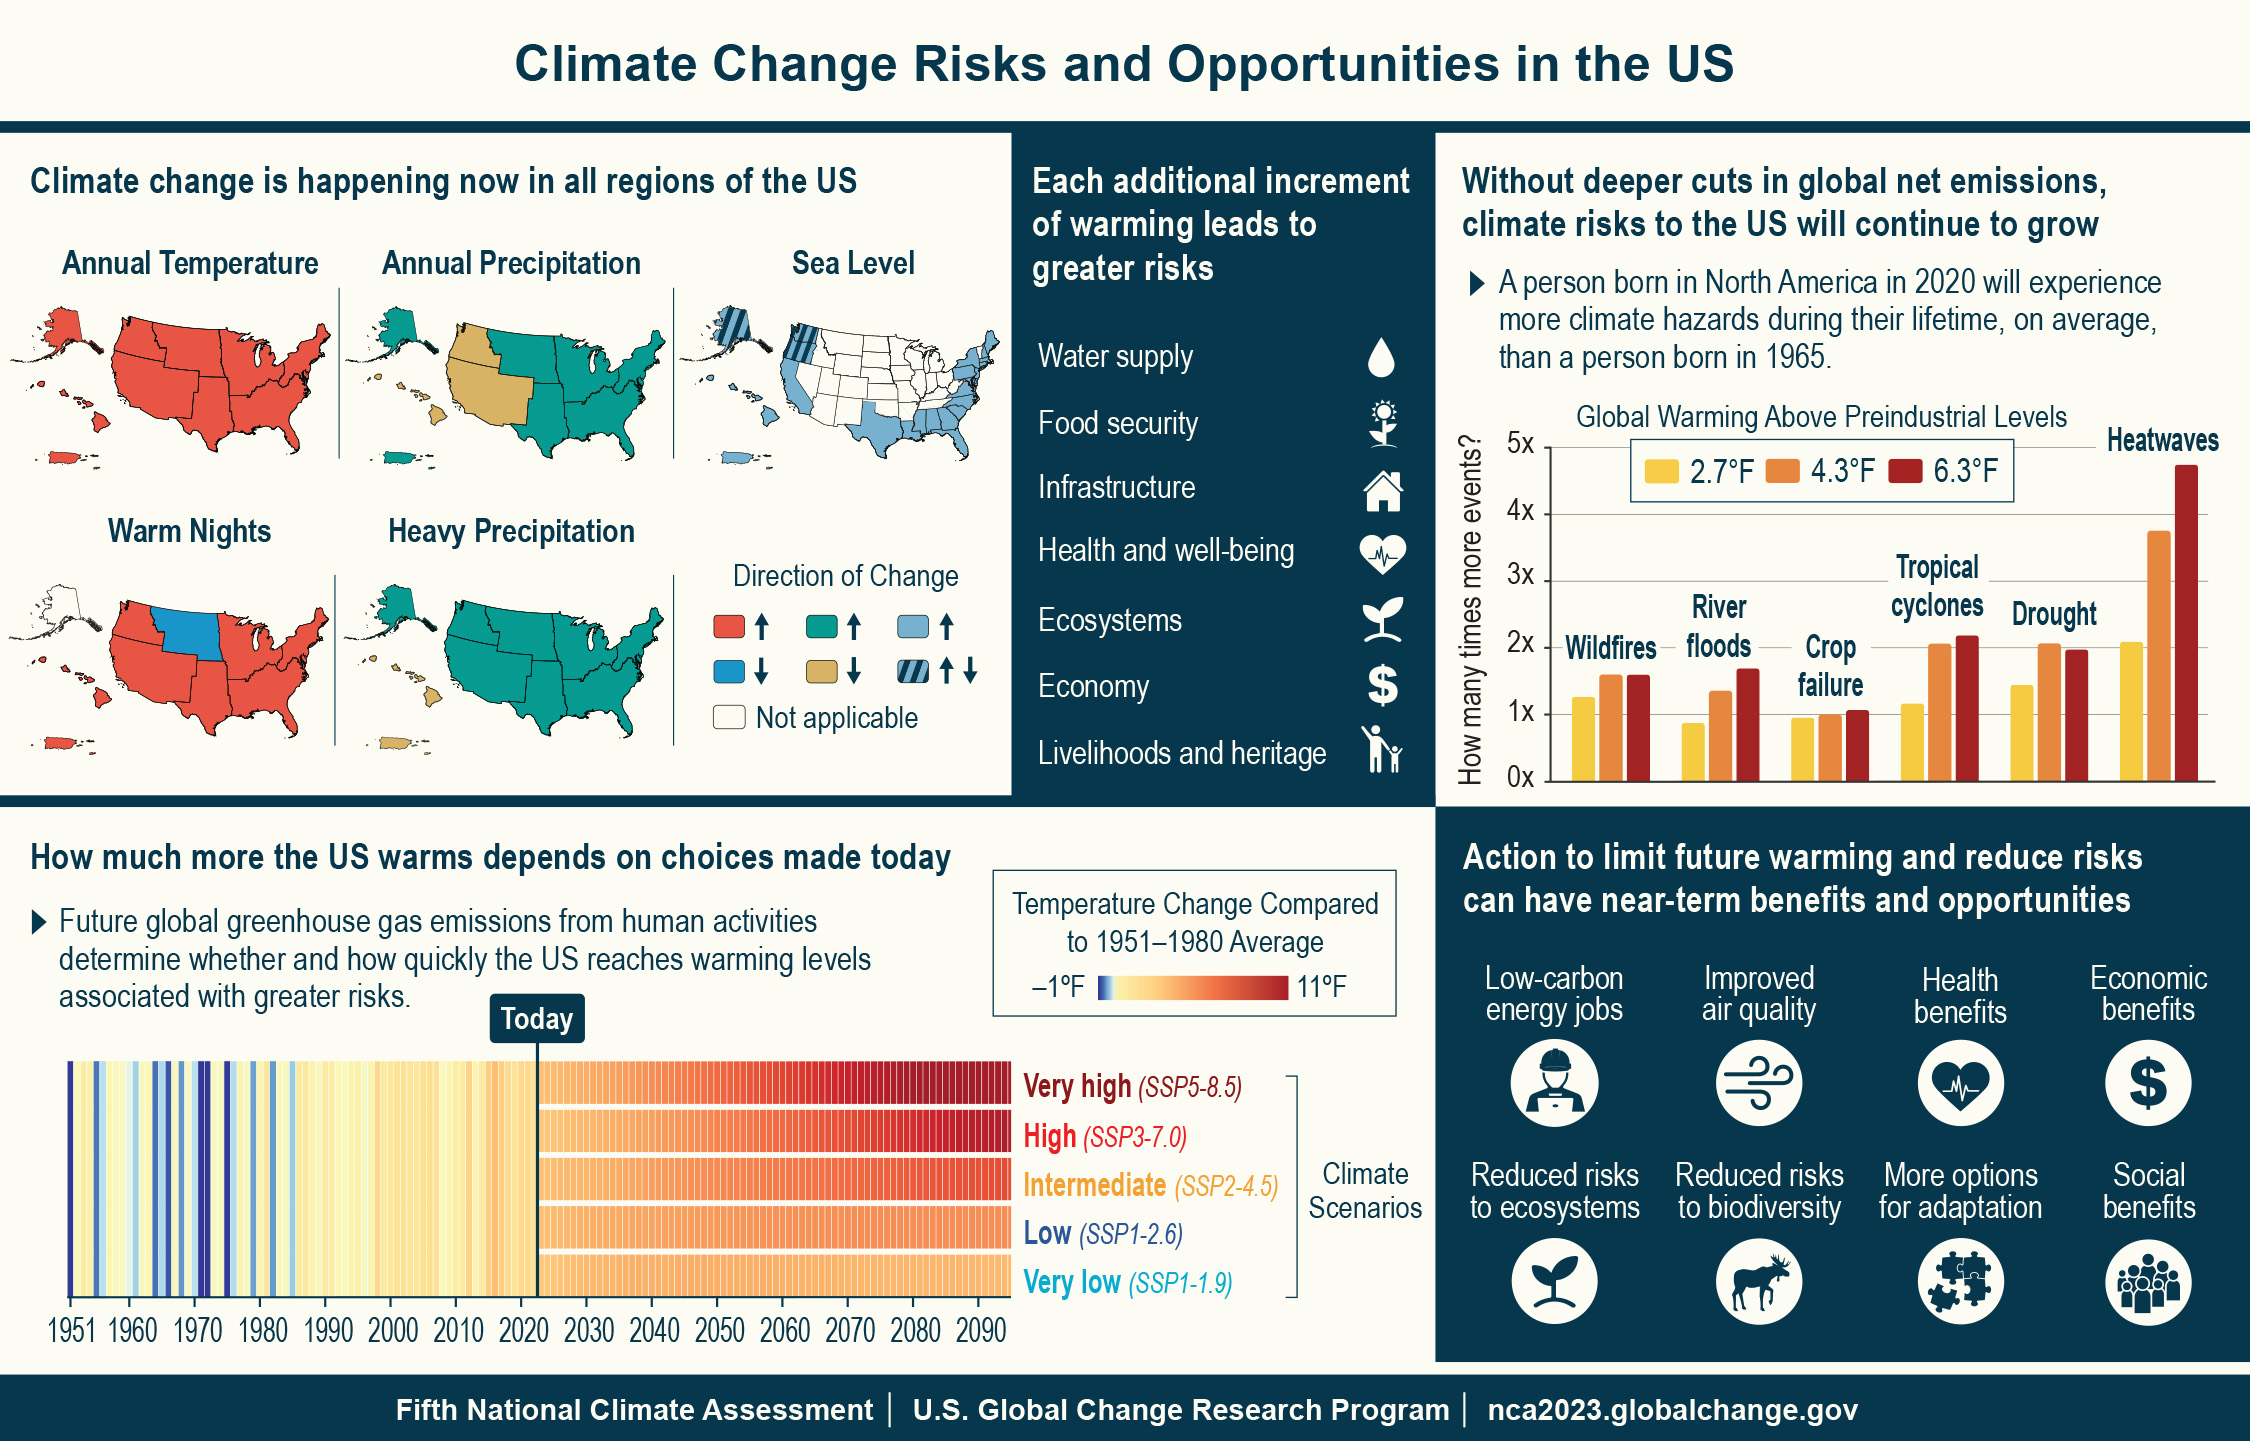
It is unequivocal that human activities have increased atmospheric levels of carbon dioxide and other greenhouse gases. It is also unequivocal that global average temperature has risen in response. Observed warming over the continental United States and Alaska is higher than the global average (virtually certain, very high confidence)1 . Long-term changes have been observed in many other aspects of the climate system (very high confidence). The Earth system is complex and interconnected, which means changes in faraway regions are virtually certain to affect the United States (very high confidence).
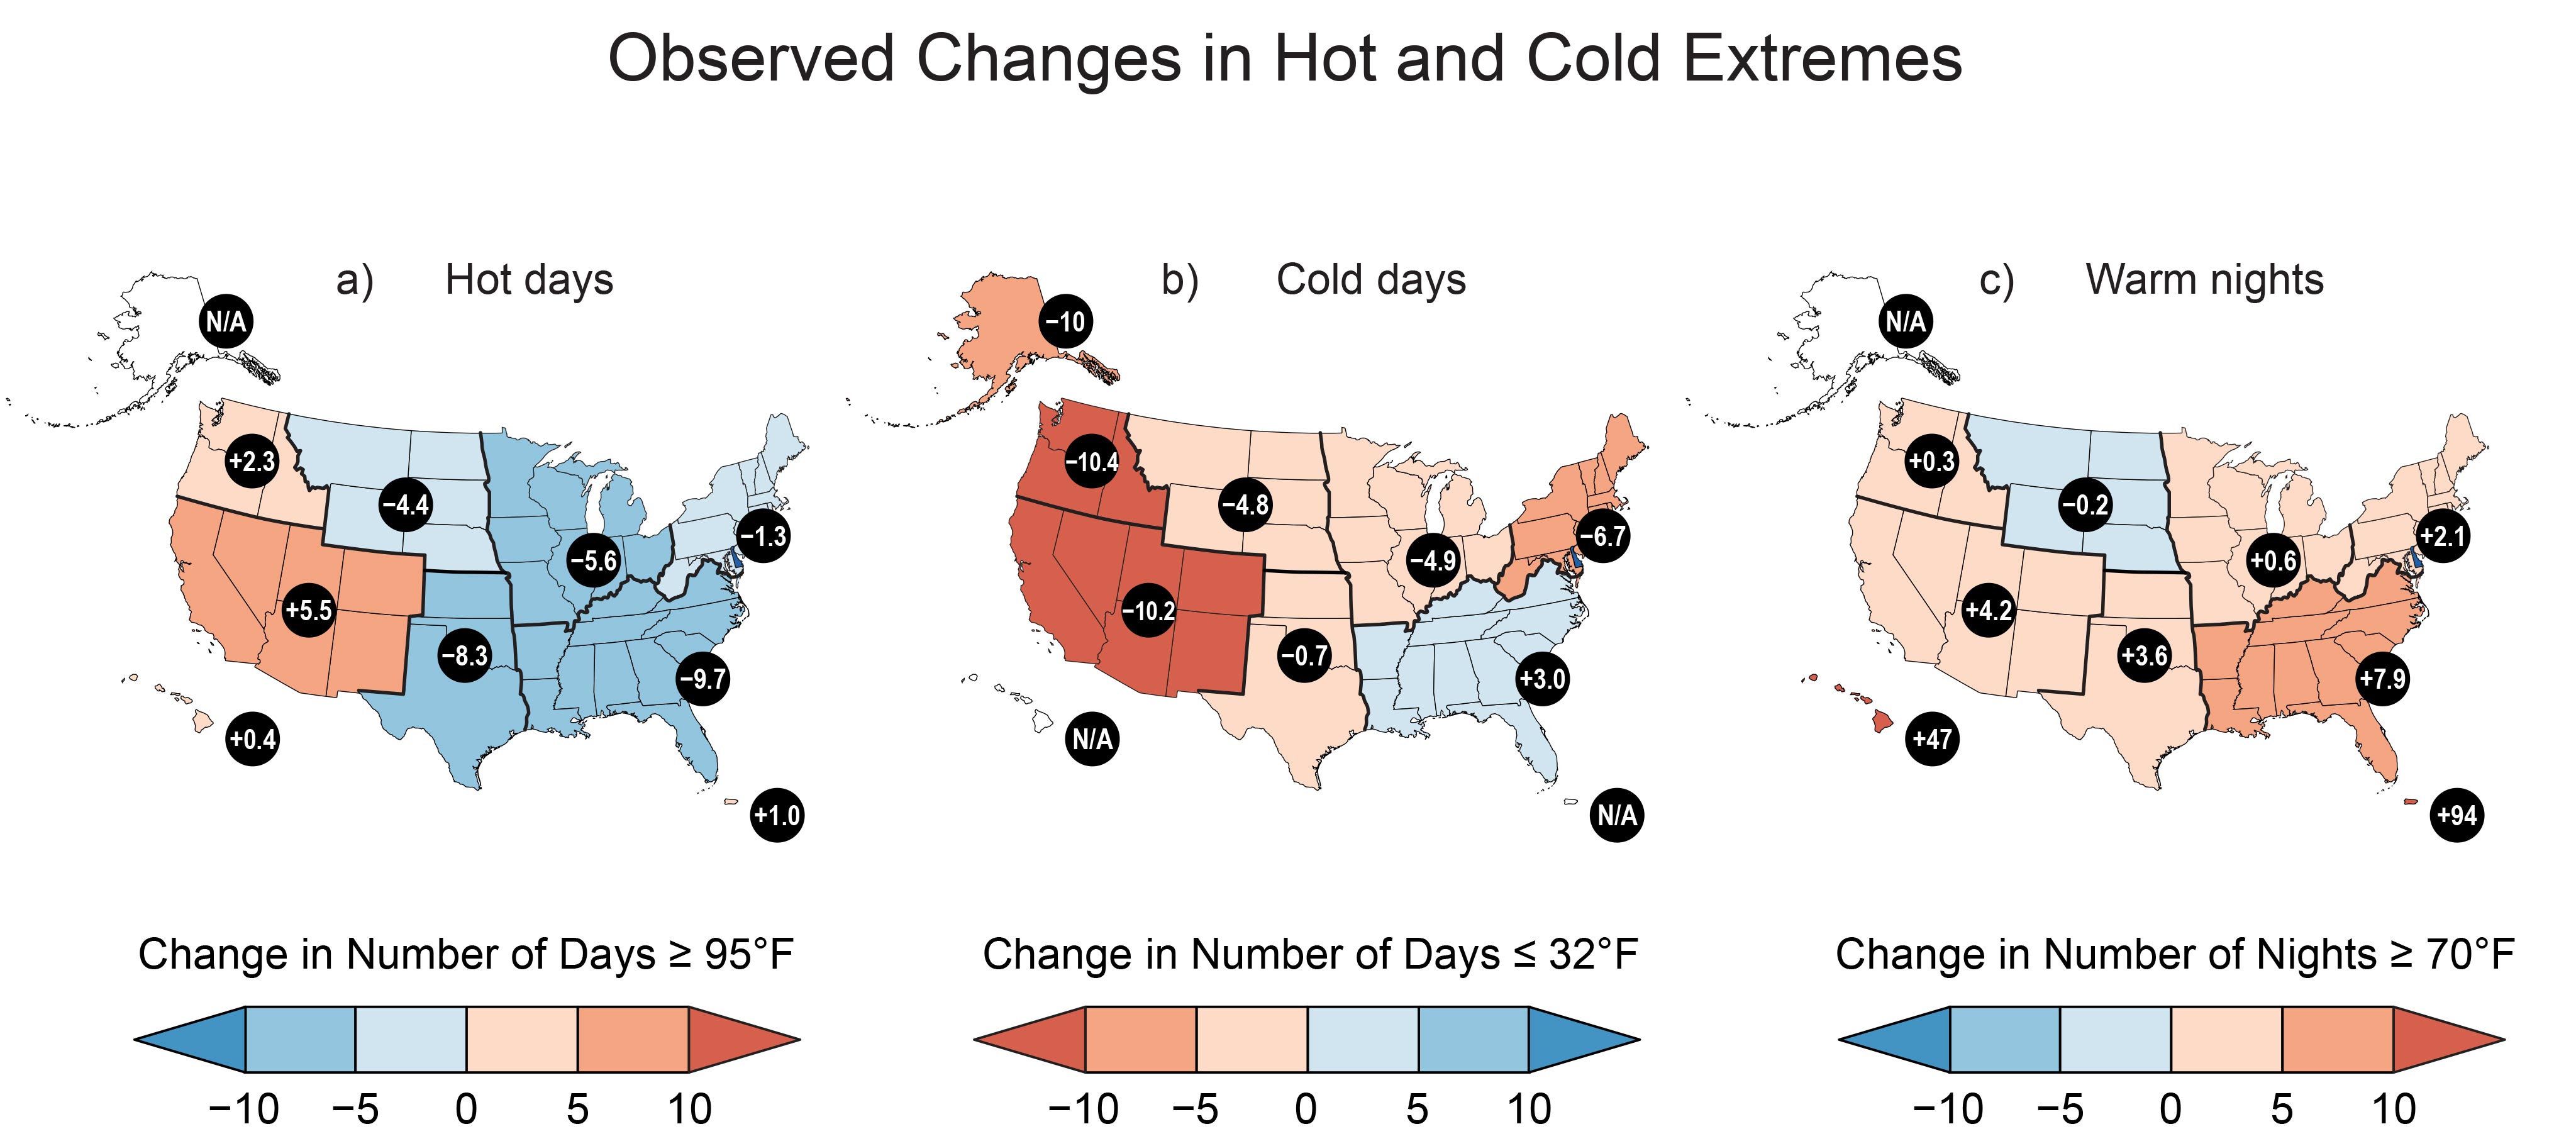
The change is climate is linked to increasing weather related disasters and strong changes in hot and cold extremes:
All these efforts to understand climate change, its impacts, and to model future climate variability are possible, because of climate and weather observations that are conducted all over the world.
More than 100,000 weather stations all over the globe are integrated into datasets that summarize how the climate has since the late 19th century:
Think about what this means for the measurements:
- How can we ensure that observations are accurate and representative of global temperature?
- What are the uncertainties of the temperature record?
- How has climate changed locally?
Our semester project will address some of the questions.
Footnotes
The 5th National Climate Assessment considers a likelihood of >99% as virtually certain and assigns very high confidence to findings with “Strong evidence (established theory, multiple sources, well-documented and accepted methods, etc.)” and “High Consensus”.↩︎