Lab 5: Week 2 - Writing Data to the Cloud
Purpose
In this third part of the thermocouple lab you will add to your Python script to record data on the Could so that it can be accessed by any device, at any time, and from any location. You will also create a Graphical User Interface (GUI) to present the data clearly to the user.
Learning Goals
The goals of this portion of the Lab are to:
- Become familiar with Python programming used to control sensors and physical systems
- Recognize Cyber Security Requirements used to protect Cloud computing
- Read/Write Data to the Cloud
- Create a Graphical User Interface (GUI) to present data to users on any device
Background
Cloud computing is revolutionizing data storage and remote access. Already many entities have migrated to the Cloud, so that data, files, and photos can be accessed by any device, at any time, and from any location. Google, Amazon (AWS), Apple, and many other high-profile tech companies are making it clear that this is the way of the future because Cloud storage eliminates the need for local storage systems (i.e. - hard drives, flash storage, etc.) that can fill up personal computers. In addition to essentially unlimited data storage, Cloud computing also offers enhanced (centralized) security systems and more powerful data processing that can evolve over time. A potential drawback is that many Cloud storage systems are implementing subscription services where users are required to pay annual fees to access their data – and will need to do so for perpetuity unless they decide they no longer need to access their photos/files/etc.
We will be using Google Sheets for our Cloud Computing. To do this, we will need to activate the API. An API is an Application Programming Interface. We will also need to download security Credentials to authorize the RPi, create a Python script to receive a security token, and use both to allow the RPi to read and write data to your Cloud Account.
This lab assumes you have already completed Steps 1 and 2
- Step 1: Setting up a new google account
- Step 2: Establishing Cloud-based data storage - establishing Google Sheets API
These were done previously
Methods: Establishing Cloud-based data storage - Step 3: Creating the Google Sheets
- Open the web browser on the RPi and log-in to Google Sheets using the google account with the activated API.
- Create a new blank spreadsheet.
- Give your spreadsheet a name by clicking on the top left corner where it says Untitled Spreadsheet.
- Make Headers for the first three columns as shown below (Date and Time, Celsius, Fahrenheit).

Methods: Establishing Cloud-based data storage - Step 4: Add credentials to Pi
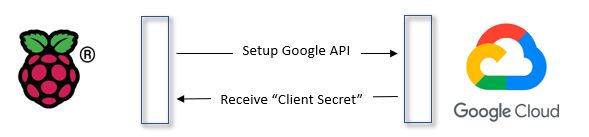
When you set up the google sheets API you downloaded a file named credentials.json that was generated by Google as our first step in navigating the Google API Cyber Security.
If you don’t have your file you can re-download it from the google.cloud Console.
You need to copy the credentials.json into the same folder that contains your Python scripts.
In the following steps, we will create a Python script that will show this credentials certificate to Google. When we run the script, it will open a web browser window and Google will then ask you to log-in to your Google account and verify that this new entity is allowed to read/write to your Google Sheets.
Once you acknowledge that this new entity is allowed to read/write to your Google Sheets, Google will provide you with a token.json file (in your downloads). You will need this token.json file to complete the process.
We will next update the RPi and install the Google Client Library that will be used by our Python script.
Methods: Establishing Cloud-based data storage - Step 4: Understanding the Process Flow
The Client Secret that we just generated using the Google API Dashboard is just the first step in a complex security process that is intended to ensure that only truly authenticated participants are able to access your data. We have completed the first two exchanges in the flow diagram below.
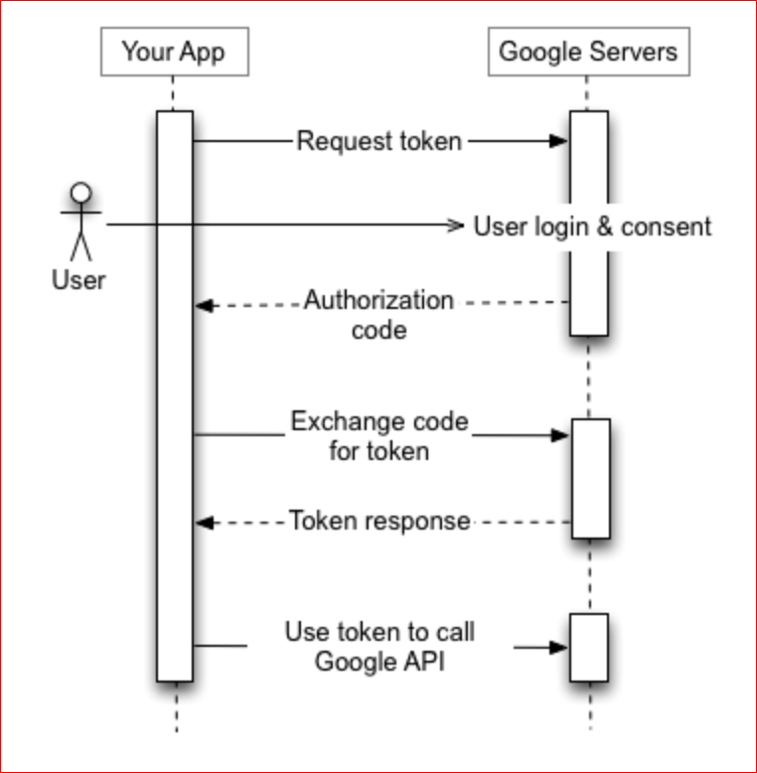
The next section of the Lab will setup the Raspberry Pi to interface with the Google Servers. We will install the Google library for Python Authentication and run a python script to request a token. You will need to verify that it is ok to provide the token to the RPi. We will use this token every time we want to access the Cloud to either read or write data.
Methods: Establishing Cloud-based data storage - Step 5: Preparing the RPi for Google API
Update the Raspberry Pi and install the Google Client Library using the command line in the Terminal.
Update the RPi: Power up and open the Terminal (command line). Execute the below commands:
sudo apt-get update
sudo apt-get upgrade
When asked, confirm to proceed with
Y.Install the Google Client Library by typing (or copying) this into the command line:
pip install --upgrade google-api-python-client google-auth-httplib2 google-auth-oauthlib
Methods: Establishing Cloud-based data storage - Step 6: Python Authentication Script
Open Thonny: We will be creating a script to download the essential security credentials and security tokens needed for permission to access Google’s API and write data to the Google Cloud.
Go to GitHub: I have placed the base-code for security measures in the ISAT300 repository.
https://github.com/TobGerken/ISAT300/tree/main/LabCode
Copy and paste the code named
quickstart.pyinto your Thonny development environment.Save
quickstart.pyand close Thonny. We will be running the script from the command line.The
quickstart.pyfile must be located in same directory as thecredentials.jsonfile.NoteIf you need to re-download the
credentials.jsonfile, you can do so from the google Cloud Console following the last step from here.Go back to the Terminal window and run the
quickstart.pyPython program by typing:python quickstart.pyThe
quickstart.pyprogram is provided by google to access the google sheets API you have previously set up and to retrieve the access token needed to authenticate your RPi with google.Running the program should prompt the web browser to open and a Google webpage to appear. Log-in to the Google Account that you authorized as a test user with your username and password. Agree to everything to allow
quickstart.pyto have access to read and write data to your Google sheets. Google will warn you that the app is not authorized and that you should only continue if the know the developer. Select Continue.If everything was successful, you should see a list of names in the Terminal window that were read from a public google sheet and a new file in the home/pi directory called
token.json. You should now be able to read and write to Google Cloud.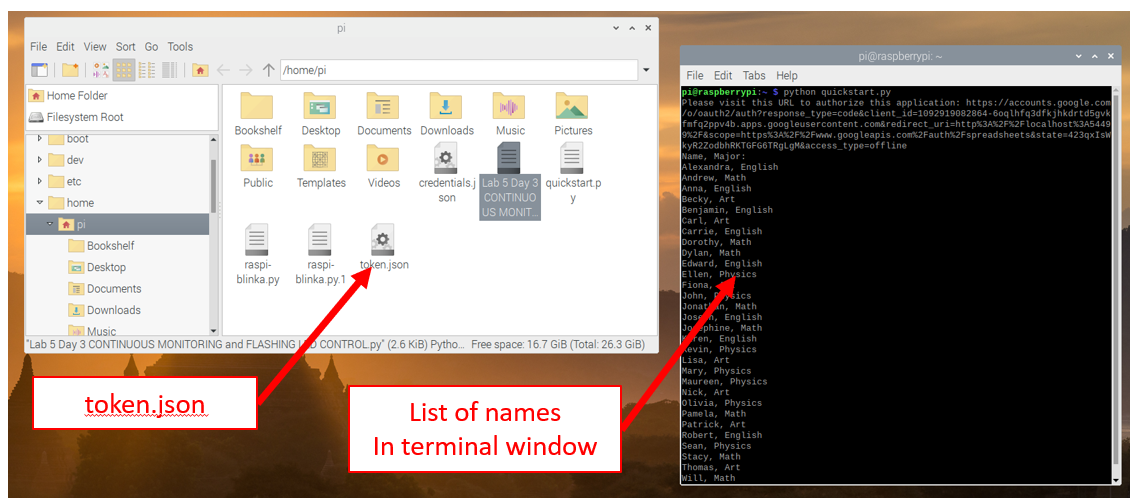
Obtaining the access token using quickstart.py
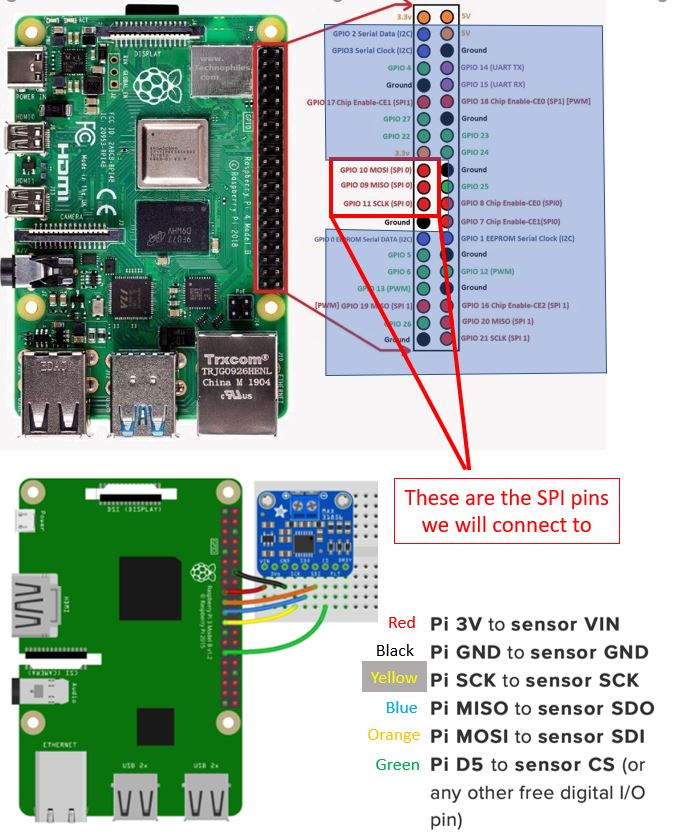
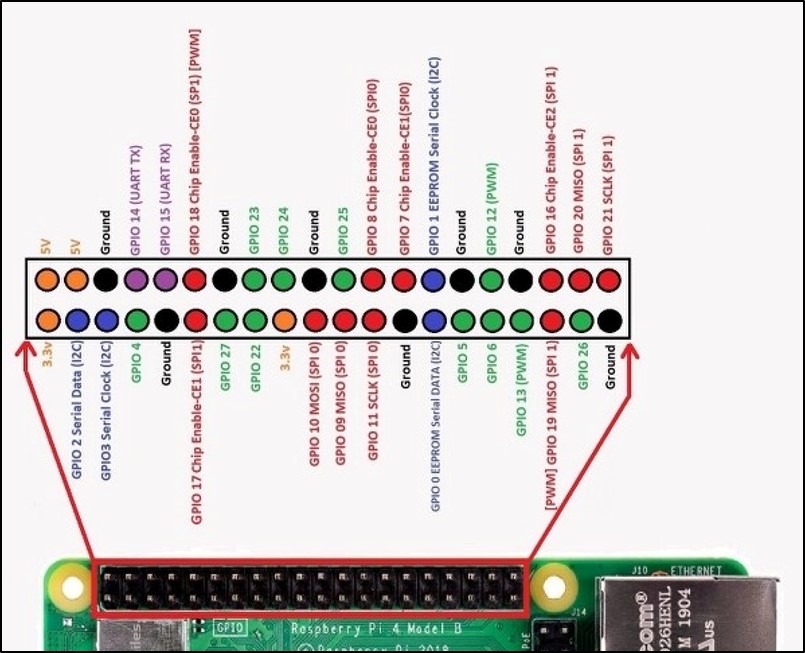
Methods: Step 7 – Thermocouple hardware connection
Connect the RPi to the MAX31856 and thermocouple as you did in week 1
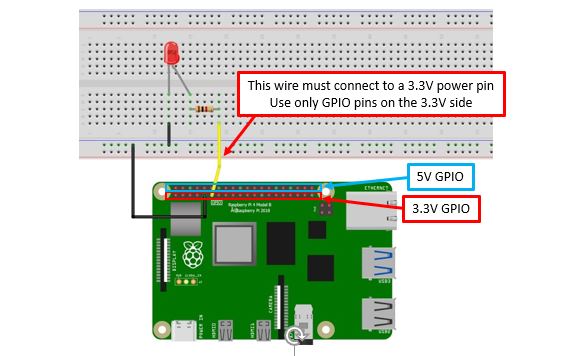
Methods: Step 8 – Physical connection for the LED (optional)
You may want to connect an LED like you did in week 2. This is optional today, but will be required next week.
Methods: Step 9 – Software connection to write data to the Cloud
You will need to modify the code that is being provided for today’s lab. First, you must change the Spreadsheet ID to match your own Google Sheet and then you must modify the code to write the temperature data to the cloud.
Open the Thonny development environment
Go to GitHub and navigate to the ISAT-300 page
Open the
ISAT 300 Lab 5 DAY 3 WRITING TO THE CLOUD Start.pyPython script. Download the file or copy it into Thonny.NoteThe starter code you downloaded contains a starter script to write data to a google sheet using the google sheets API.
The full scope of the API can be found in the official API documentation
Open the Google Sheets spreadsheet you created. The Spreadsheet ID is located in the web address.
Click on the web address for your Google Sheet and scroll until you can see the end.
The Spreadsheet ID is located between two
/ ... /just before the/edit#gid=0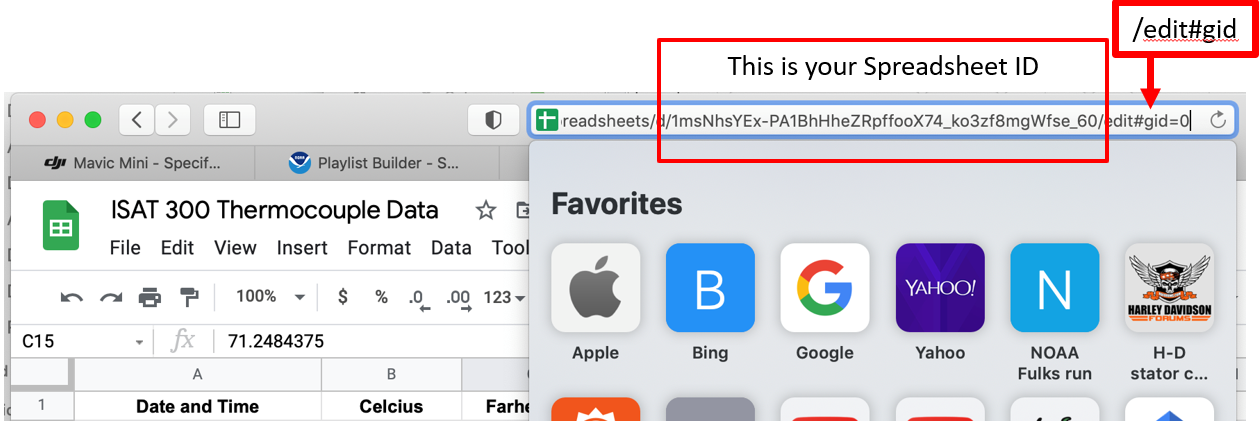
Locating the spreadsheet ID Copy the Spreadsheet ID and paste it into the Python script in the correct location
IF you have setup the Google Sheet to have the same three headings, you do not need to change anything else.
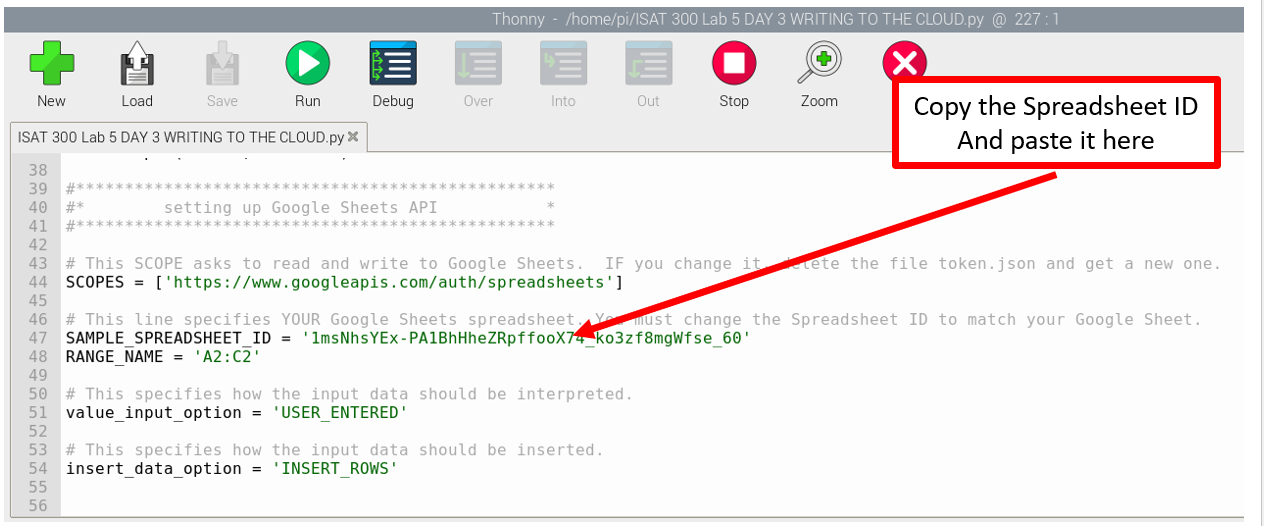
Updating the code with the spreadsheet ID Save the Python code and run it. You should see values appear in your Google Sheet.
The data that has appeared in the google sheet is not the thermocouple data. Examine the code you executed to find identify the location where it:
- Sets up the connection to the google sheets API
- Authenticates the user
- Sets the values that are written to the google sheet
- Actually writes the values to the google sheet
Don’t worry if you don’t understand what each line does exactly. The goal is to have a broad strokes understanding
Updating the program to include your thermocouple measurements
Use your code from the previous week to add to the starter code. I have provided comments in the starter code that show you where you have to add certain lines. You can copy these over from the program you used in the previous lab.
Go through your program from week 2 and identify, where in the code each of the following happens:
- Import the packages used by the thermocouple and LED GPIO
- Set up the LEDs
- Set up the thermocouple
- Modify the loop such that each iteration of the loop reads the uncalibrated thermocouple temperature
- Applies the calibration
- Prints uncalibrated and calibrated temperature to screen in oC and oF
- Writes the calibrated temperature data to a
.csvfile - Sets the LED based on the condition of the calibrated temperature
- Writes the calibrated temperature to the google sheet using the API
Then copy over the code into the program to write data to the cloud. As you modify your program, make sure that:
- Initialization and setup statements - that only need to run a single time - are placed outside the loop
- You have a single loop for conducting the measurements and recording your data
- Have a final measurement and write step after the loop to ensure that a final temperature is measured and written to the csv-file as well as the google sheet.
Your code currently uses a
for loopwhich executes a loop a fixed number of times.for i in range(10): <do something>You may be remembering from your programming class, that there are also
while loopsthat may look like this:while (temp < 20): <do something>Think about the following questions:
- What is the crucial difference between a
forand awhileloop? - How long will a while loop run?
Replace your
for loopwith awhile loopand set it up that the loop stops running when the calibrated temperature reaches a certain value.Test your code and watch data being written to the cloud.
- What is the crucial difference between a
Stop your code from running.
TipI recommend using a
for loopfor any testing and to switch over to a while loop once your software works.You will need a working
while loopnext week, when we will do continuous temperature monitoring.Test your code by writing 100 or so values to the cloud. If you set the measurement frequency (
time.sleep(<wait time in seconds>)) too high, your code will produce an error message. Read the error message and try to understand why this is happening. Select an appropriate measurement frequency for your alert system.
Methods: Step 10 – Creating a Graphical User Interface (GUI)
We will create two Graphical User Interfaces in our Google Sheet for easy visualization of the data. The first will be a dial-gauge that changes in real-time. The second will be a graph of data over time.
Stop the Python script and go to your Google Sheets.
Select the Celsius and Fahrenheit headers and the 1st two lines of data below them.
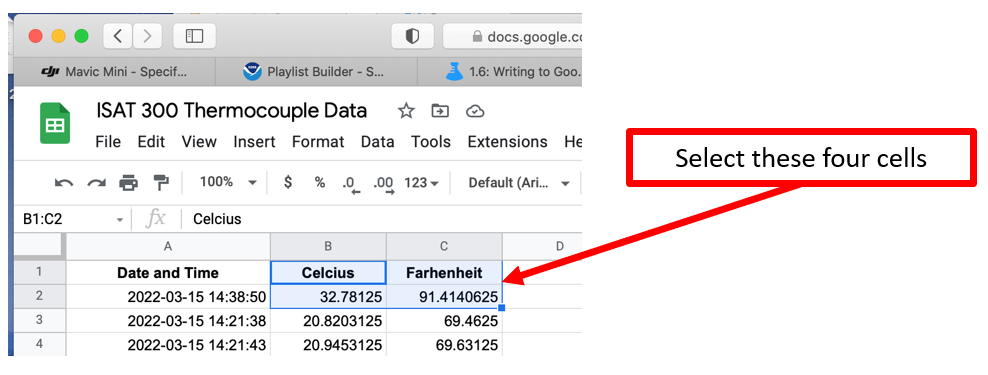
Selecting the Data Click on
Insertfrom the toolbar. SelectChart.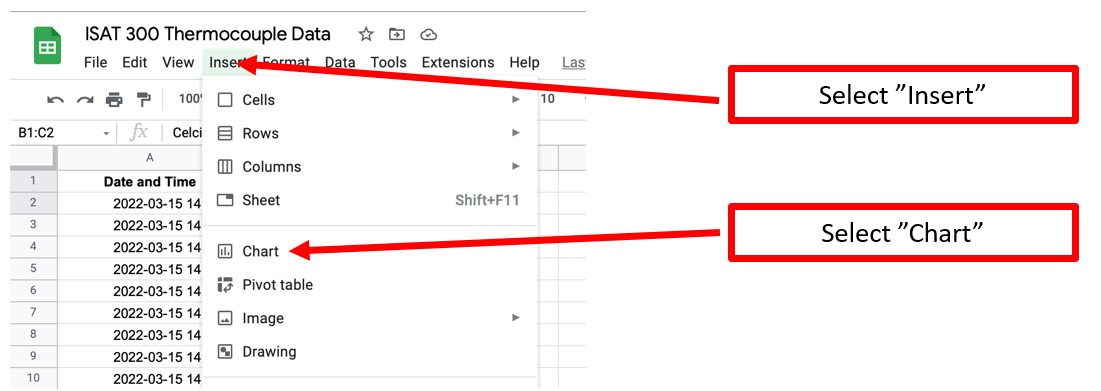
Inserting the Chart 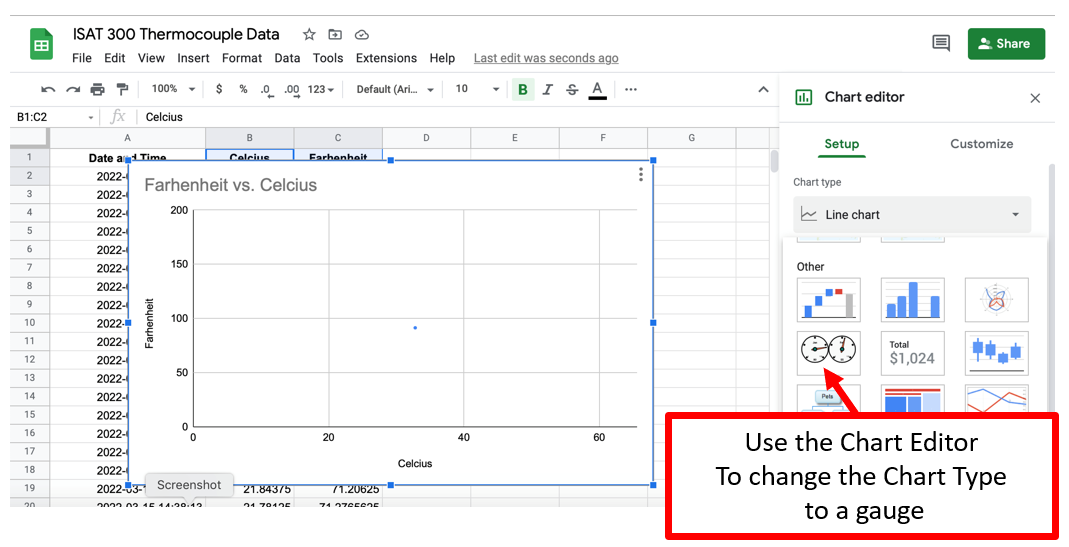
Setting the Chart Type to Gauge Adjust the settings to make the Gauges look good
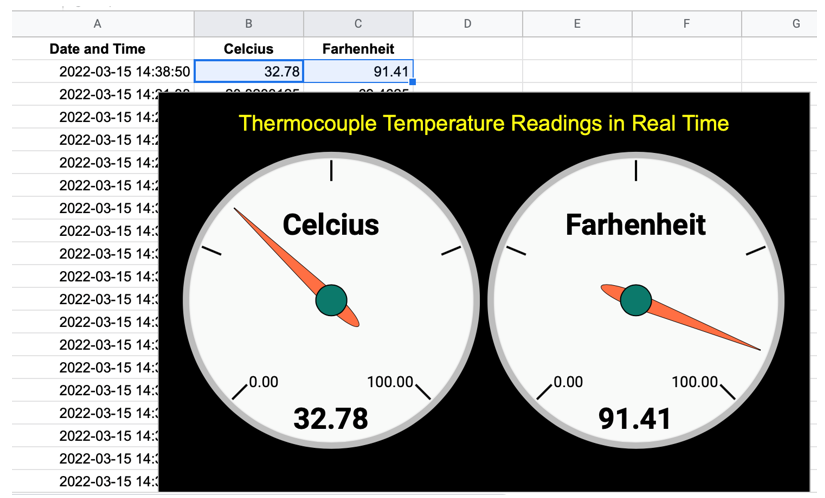
Adjusting the Gauges Go back to Thonny and run the Python script again. You should see the gauge change in real time. (However, there will be a slight delay for the security authentication and data transfer)
Create a graph that changes over time by highlighting the first three columns and creating an area chart.
Adjust the cells so the data starts with
A3to eliminate the final data point used for the gauges.Make this graph look nice.
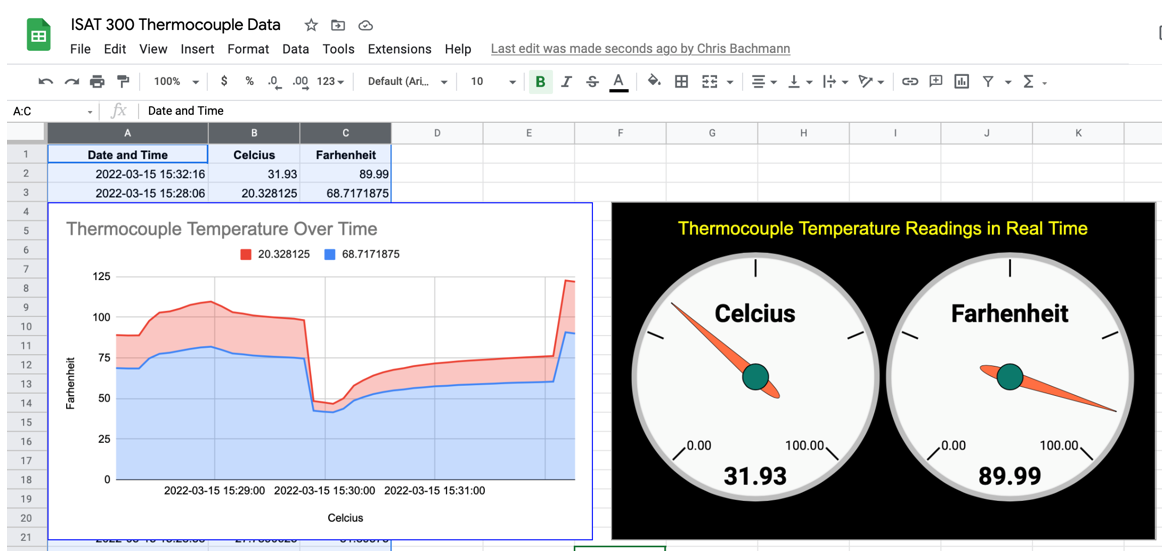
Finalizing the Dashboard Share the link to the Google Sheet with everyone on your Team. Install the Google Sheets App on your phone and watch the gauge and graph change on many different devices all at the same time!
You are now writing data to the Cloud, which can be viewed by anyone, anywhere, at any time!
Acknowledgements
This Lab was designed by Dr. Chris Bachmann with modifications by Tobias Gerken. Special thanks to Joe Rudmin for helping secure necessary equipment and for providing lab support.
| Revision | Description | Author |
|---|---|---|
| 2025-03-19 (S24) | Updates for clarity and code structure | Tobias Gerken |
| 2024-03-15 (S24) | Updated to Web and updates for clarity | Tobias Gerken |
| Initial Version | Chris Bachmann |