Lab 3: Temperature Sensor Characteristics
Purpose
The purpose of this lab is to give you an opportunity to directly observe two characteristics of sensors with a first-order system response.The systems you will observe are using two common sensors to measure temperature – a thermistor and a thermocouple. When combined with signal conditioning and display components, these sensors become a useful temperature-measuring instrument. You will measure response times to a step input change in temperature for two cases: when the temperature suddenly increases and when the temperature suddenly decreases. You will calibrate the thermocouple using a two-point method and test your calibration by measuring body temperatures.
Learning Goals
Upon successful completion of this laboratory, you will be able to
- Describe the behavior of a first-order sensor response to a step change.
- Calculate the time constant for a first-order sensor from dynamic response output data.
- Explain the physical significance of a first-order time constant.
- Describe the practical consequences of a sensor or instrument having a large or small time constant.
- Report your measurement findings with the appropriate uncertainty or error limits.
- Calibrate the response of a thermocouple and use it to measure body temperature.
Background
One of the most common measurements is temperature. Temperature information is important in many different applications: environmental quality, industrial Processes and even measurement systems themselves, because instrument sensitivity and precision are often temperature dependent. Today you will be working with an environmental probe for temperature. A wide variety of sensors have been developed and used to sense temperatures in air, water, and other environmental media. In this activity, you will determine and compare the response times for several temperature sensors used in monitoring water temperatures.
Among the many characteristics that describe sensors, response time is an example of a dynamic characteristic that is important to consider. If you are monitoring air or water temperatures that change rapidly, you will want to select a sensor with a fast response time.
To determine the response time, we will use a step input and assume the sensor acts as a first-order system. For a first-order system, the time constant is a measure of the time it takes the system to reach 63.2% of its final value. The response time is dependent upon the tolerance band for the sensor (as defined by the manufacturer or user).
Thermocouples
Thermocouples are sensors that are used to measure temperature. Thermocouples are constructed by welding two wires of different metals together. Whenever two dissimilar metals are in contact, a very small voltage is generated across the junction. This is an example of a thermoelectric effect and is called the Seebeck effect. The voltage is on the order of a few millivolts and is a function of temperature. Because the voltage generated at this junction is very low, thermocouples are susceptible to electrical noise. A less-noise prone device utilizes a different type of temperature sensor known as a thermistor. Thermistors are semiconductors that change their resistance as a function of temperature. The advantage of thermocouples over thermistors, however, is that thermocouples are relatively inexpensive, easier to make, and respond more quickly to changes in temperature. That is because thermocouples have a relatively small time constant.
Calibration
Thermocouples and thermistors produce a voltage output that is proportional to the temperature they are exposed to. Therefore, it is necessary to calibrate this voltage to known temperature standards. Because thermocouples show linear sensor response behavior, it is possible to perform a two-point calibration. This means we can measure the voltage output of the sensor for two known temperatures (\(T_1\), \(T_2\)). This allows us to measure the change in voltage output (\(\Delta V = V_2 - V_1\)) for the change in temperature (\(\Delta T = T_2 - T_1\)) and to calculate the sensor sensitivity (\(S\)) as:
\(S = \frac{V_2-V_1}{T_2 - T_1} = \frac{\Delta V}{\Delta T}\)
Knowing the sensitivity allows for estimation of an unknown temperature \(T_x\) using:
\(T_x = T_1 + \frac{(V(T_x) - V_1)}{S}\)
Two-point calibration procedures are commonly used in measurement science. Often the calibration parameters are included in the sensor system, allowing the sensor system to calculate and output the quantity of interest. For example, the thermocouple you are working with today, comes with an amplifier and analog to digital converter, which will translate the voltage output into a calibrated temperature.
For many instruments, it is possible to manually update calibration constants and manufacturer specifications require periodic re-calibration of the system.
Materials
- Raspberry Pi Computer
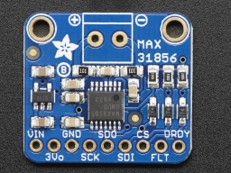
- Adafruit MAX31865 Temperature Sensor Amplifier and A/D Converter (Spec Sheet)
- Thermocouple
- Breadboard and wires for connection
- Ice bath
- Hot water bath
- Digital Multimeter
- Instructor Demonstration:
- LabQuest meter (Materials)
- Temperature probe, stainless steel
- Temperature probe, surface contact
Lab Exercise
Hot water bath is boiling. Do not move it from the hot plate. Take care to avoid scalding yourself or others.
Part I: Temperature Response Time Measurements
Connect the thermocouple sensor to the analog-to-digital converter
In this part of the lab, you will construct a temperature probe using the RPi computer and the thermocouple.
The thermocouple sensor will give an output voltage that corresponds to temperature. You can test this by using your DMM. If you set your DMM to measure DC voltage, you will see that there is a potential difference between the two leads of the thermocouple. This voltage will change linearly with the temperature of the thermocouple. For this output voltage signal to understood by the RPi, it must be converted to a digital signal (the RPi does not accept analog signals, only digital). We will use an analog-to-digital converter (A/D board) to do this.
The A/D board we will be using is specific for thermocouples and can handle a wide range of types. This board (the MAX31856) will convert the analog voltage signal to a digital signal, and will do the mathematical conversions necessary to convert the received voltage into a temperature reading before sending the data to the RPi. The process of determining the correct mathematical conversion is called sensor calibration. This means that the A/D board is already calibrated to our thermocouples.
You will directly measure the voltage output from the thermocouple in Part 2 of the lab and manually calculate the calibration coefficients for the calibration performed by the A/D board.
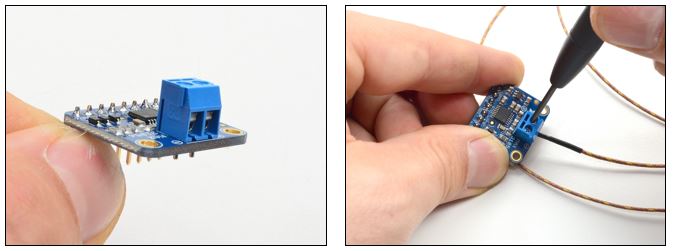
Connect the thermocouple to the MAX31856 A/D board.
Annoyingly, Yellow is (+) and Red is (-).Be sure to get (+) and (-) correct.
Connect the thermocouple to the A/D board like in the figure below (@fig_connecting_TC):
Software connection
We will be using Python3.7 and CircuitPython in this lab. We have already used Python in the previous lab, but CircuitPython is new.
This means we have to install CircuitPython. We also want to make sure that we have a compatible Python3 installation.
You will be using the command line to perform these installations and checks.
Linux Terminal: Open a terminal window by clicking on this icon in the upper left of the control bar. This opens the command line, which will be used to enter your commands (Figure 1).
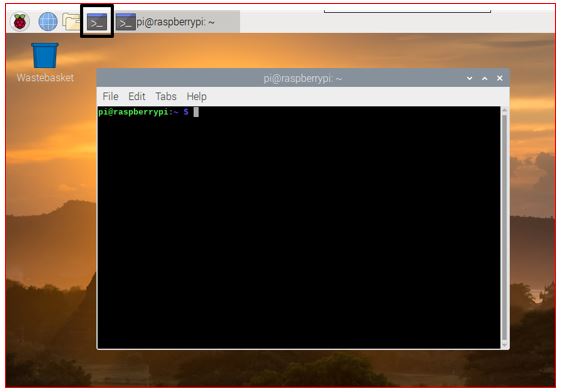
Figure 1: The Linux Terminal Update the RPi: First we want to make sure that our system is up to date.
NoteHelpful terminologysudo: super user do, which means following commands have root-level access. Anything executed withsudocan have serious consequences as system files are being changed.apt-get: package manager for linus, which is used to install and maintain new softwareapt-get update:aptchecks for updates of installed software on the internetapt-get upgrade:apdfetches and installs any available system updates
This means running the below commands will check for and install any system updates. It is good practice to do this regularly.
sudo apt-get update

sudo apt-get upgrade
Python Maintenance:
NoteHelpful terminologypip3: a package manager for Python v3. Similar toapt,pipis used to download and install python packages.setuptools:Setuptoolsis a collection of enhancements to Python that allow developers to more easily build and distribute Python packages, especially ones that depend on other packages.
We install/ upgrade the
setuptoolsexpansion forpip3which is needed.sudo pip3 install --upgrade setuptoolsIf the above does not work, we need to install
pip3first (and then repeat the above step)sudo apt-get install python3-pip
Software Connection - Blinka and CircuitPython
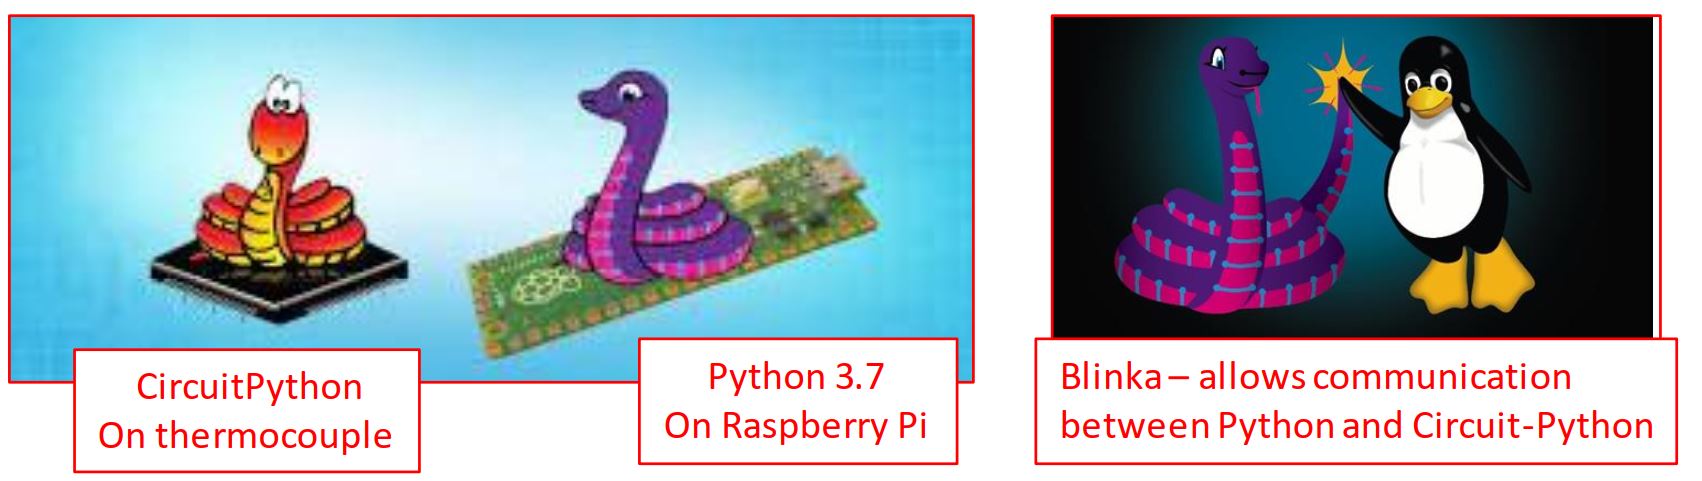
The MAX31856 uses CircuitPython and SPI + I2C communication protocols. The Raspberry Pi will be using Python3.7 (which is different than CircuitPython).
In order to be able to communicate between the RPi and MAX31865, we will need to install a package called Blinka to connect the two systems.
CircuitPython and Python are similar, but not the same. CircuitPython is lighter version of Python – i.e. – it takes up less space – and is used on devices that have lower computing needs. CircuitPython was created by Adafruit (it is a version of MicroPython) and is used on many Adafruit products (such as our thermocouple board). Python is more robust.Blinka (from the creators of CircuitPython) allows the Python 3.7 on the RPi to communicate with the Circuit-Python scripts on the thermocouple analog-digital converter board.
Installing blinka: Adafruit has put together script that configures your RPi and installs blinka. The next lines will walk you through the process.
NoteHelpful terminologyadafruit-python-shell: A shell-script is a set of instructions that is run on the command line. Installing theadafruit-python-shellensures that shell scripts can be executed.wgetis a command to download (get) a file from the web.
So the next two commands, will install the python-shell and then download a python script to install
blinka.TipRunning the commands may produce an error. Luckily the error-message will tell you what to do. Follow the instructions to resolve this.
In general read the output in the terminal to ensure that things are working (or not) as planned
sudo pip3 install --upgrade adafruit-python-shell wget https://raw.githubusercontent.com/adafruit/Raspberry-Pi-Installer-Scripts/master/raspi-blinka.pyNoteIn the PDF version of the document the
wgetline cuts off. It should read:wget https://raw.githubusercontent.com/adafruit/Raspberry-Pi-Installer-Scripts/master/raspi-blinka.py
Then we need to run the script to finish the setup.
sudo python3 raspi-blinka.pyIt MAY (or may not) ask you to confirm. If it does, type Y to accept
Re-boot the Pi to finalize everything that has just been installed.
Wait until your RPi restarts before proceeding to the next step.
In the meantime, here is more information on what you just installed.
CircuitPython: open-source programming language developed by Adafruit designed to simplify experimenting and learning code on micro-controllers. It is based on MicroPython, which is a stripped-down version of Python used commonly with micro-controllers because it doesn’t require as much memory or computing power.
Blinka: translates CircuitPython hardware Application Programming Interface (API) so that the hardware can communicate with the RPi (which is using Python3).
SPI: Serial Peripheral Interface – communication protocol requiring 4 channels: a clock, output from computer to device, input from device to computer, and a Chip Select (for multiple devices)
I2C – Inter-Integrated Circuit – communication requiring only 2 channels: in and out, but is still synchronizes data transfer between the two systems. Hardware using I2C is more complex than SPI, but wiring is simpler, especially when controlling multiple devices (only 2 wires instead of 4).
Software Connection Test
Before going further, we need to test the Python3-Blinka-CircuitPython install we just completed.
We can do this by running a simple program (named ISAT 300 blinka test.py), you can download from my github:
https://raw.githubusercontent.com/TobGerken/ISAT300/main/LabCode/ISAT 300 blinka test.py
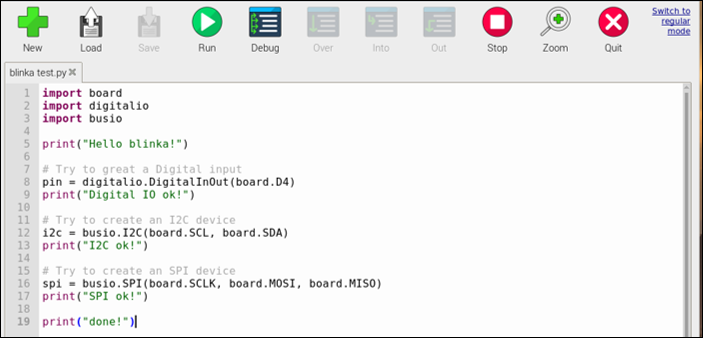
If everything is working correctly, you should see this when you run it:
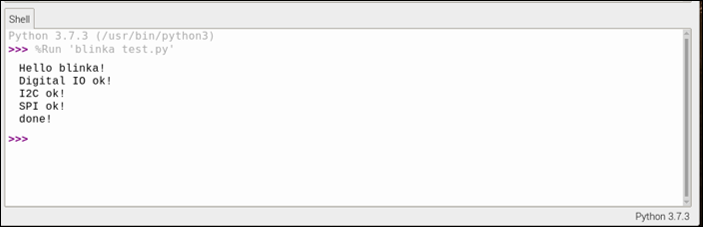
You have just setup a computer so it can interface with external devices using both SPI and I2C protocols, Python3, and CircuitPython!
Software Connection Part II
The MAX31856 is more than just an analog to digital converter. The chips on this small circuit board will also provide a reference temperature for the thermocouple and are pre-programmed to convert the voltage signal into a temperature reading.
Adafruit (the company that makes this board) has also provided Python packages that we will need to install on the RPi to make the system work.
Open the
terminaland execute the below command to install the MAX31856sudo pip3 install adafruit-circuitpython-max31856
After these software packages are install, we will need to physically connect the RPi to the thermocouple A/D board.
Before connection the thermocouple: Power down the Pi to avoid shorting any connections during the wiring process!
Hardware-Connection
Shut down the RPi before making the connection and ask an instructor to get the wiring checked before turning it back on!
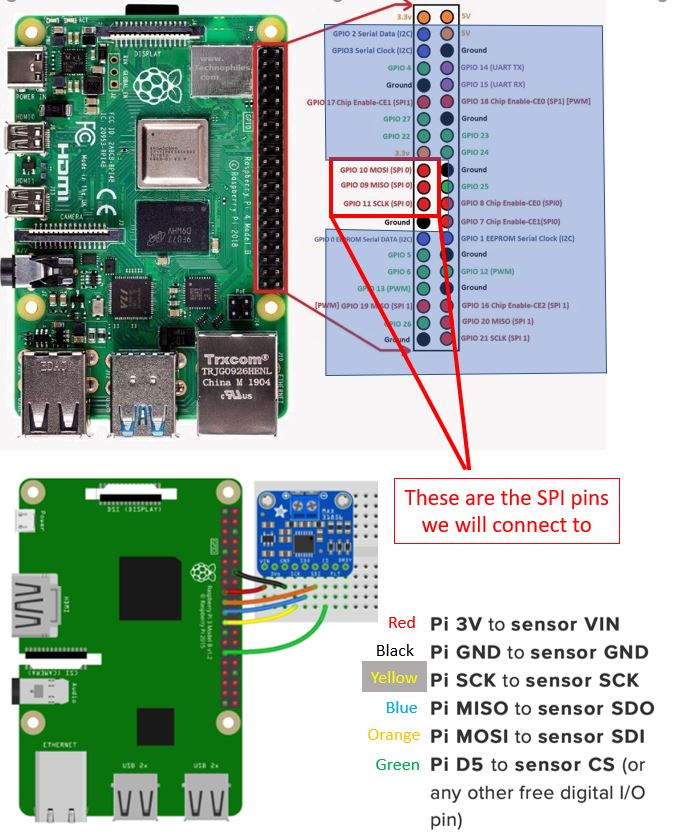
Connect the RPi to the MAX31856 as shown in the diagram below (Figure 2).
Software Connection III: Python Code to interface with thermocouple
It it is good practice to
- create a dedicated folder for your work, where you save all files that belong to a given project. This means e.g. a folder for ISAT300 that contains subfolders for each lab.
- save all files to disk with sensible names
- use typical file extensions, such as
<filename>.pyfor Python files.
Open the Thonny IDE and obtain the Lab 3 StarterCode from my GitHub:
The starter code will set up the software connection to the thermocouple and will then read its temperature.
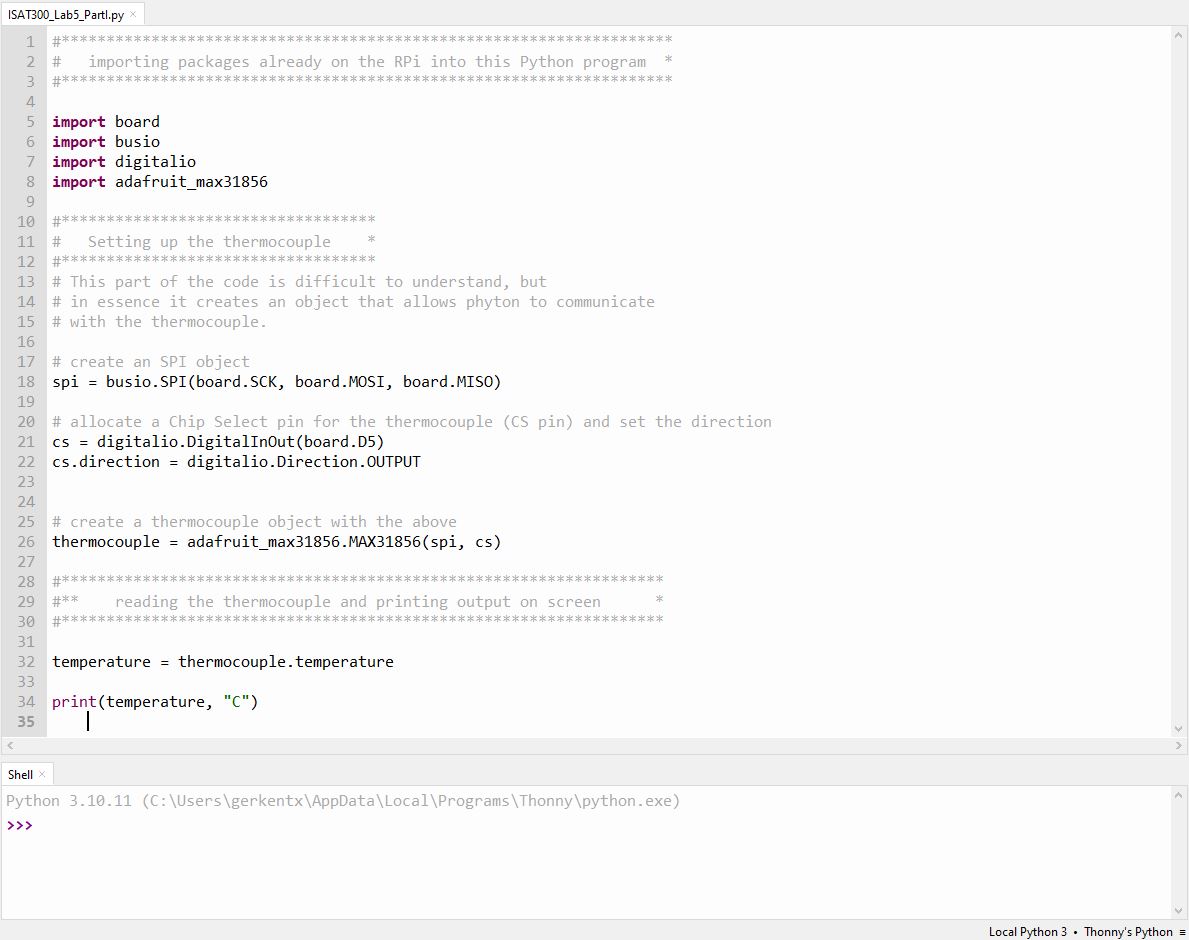
Import board: module from CircuitPython, provides access to board specific objects (pins)Import busio: module from CircuitPython, we will use for the SPI communicationImport digitalio: module from CircuitPython, will let us set the input/output for our Chip Select pin- Creating the object
thermocoupleallows python to query the temperature from the thermocouple object by accessing thethermocouple.temperatureattribute, which provides the thermocouple temperature in \(^o\)C.
Extending the code to conduct multiple measurements
Instead of doing a single measurement, we want our thermocouple to continuously read the temperature. We can achieve this with a loop. We also want to save the temperature and the time the temperature was taken, so that we can later save this our data to a file.
Write a
for-loopto conduct multiple measurements. Outside the loop, define a variablenumber_repetitions = 100. You can then use therange()-functionrange(number_repetitions)to determine how often your loop will run.Within each loop you should:
- read the thermocouple temperature and append it to a list of temperatures
- get the current time and append it to a list of times.
The below code will import the datetime module and return the current time:
import datetime # place before loop
datetime.datetime.now()
The below code will append the value
1to a list calledlist_of_values_to_storelist_of_values_to_store.append(1)
You should create an empty list for the temperatures and the times before the loop:
temperatures = []
times = []
Extending the code to write your measurements to a file:
After the first loop finished, you should create a second loop to write your data to a csv file. To make things a bit easier for ourselves, we want to write the time that has elapsed since the first measurement rather than the actual time.
You can do this as follows:f = open("temperature_measurements.csv", "a") f.write("Time_since_start_in_seconds, Temperature \n") for i in range(number_of_repetitions): time_elapsed = (times[i]-times[0]).total_seconds() f.write("{0},{1}\n".format(time_elapsed, temperatures[i])) f.close()
Experimental Procedure:
With the probes sitting in an ice water bath, start your program.
As quickly as possible transfer the probe to boiling water bath and gently stir for about 10 seconds.
WarningTake care that you do not touch the water or have your hand very near the boiling water to avoid injury!
Quickly transfer the probe back to ice water bath and stir for another 10 seconds.
Finally, transfer probe back to boiling water and stir for another 10 seconds and wait for the data collection to end.
Confirm that your data was saved to a csv-file on the RPi and that 10 seconds where enough for the thermocouple to clearly equilibrate to the temperatures of the hot and icy water.
Repeat steps 3-6 for a total of 3 Runs (make sure to change the file name for saving the file). Tip: You could create a variable for the file name. Or you could use the start time as part of the filename.
Retrieve the csv files for all three runs
Your instructor will conduct a demonstration of the same experiment using a commercial LabQuest sensor. For your analysis, you will be provided with the data from that experiment.
Part II: Thermocouple Calibration
Procedure:
- Set the DMM to the highest sensitivity available for measuring DC voltage (400 mV).
- Dip the thermocouple into the beaker with hot water. The water should be visibly boiling to ensure that the water temperature is 100 \(^\circ\)C.
- Wait for the thermocouple to read a steady voltage and record it into your lab notes
- Transfer the thermocouple to the ice water with 0 \(^\circ\)C and wait for the DMM reading to stabilize. Record it into your lab notebook.
- Repeat steps 2-4 at least two more times.
- Hold the thermocouple enclosed in your hand and record the measured voltage from the DMM, after the reading has stabilized
Deliverables
Your deliverable is a lab report that conforms to all lab report requirements.
Your results and discussion sections should at least contain the following items:
Part I:
I have modified the deliverables since you did the lab.
For the analysis of Part 1, you will work with your own data and data from a commercial sensor (Model: LabQuest). You can download the LabQuest data from Canvas. It is also posted here: Lab3_LabQuestData.csv
- Create graphs of the temperature vs time for your data. Show all trials.
- Compare the graphs from RPi measurement system to the commercial LabQuest sensor and describe differences you see.
- Compare your graphs to the step-change that you want to measure?
- Compare your graphs to the shape of the ideal first-order response.
- Compare the sampling rate from the RPi measurement system to the commercial LabQuest sensor and describe differences you see.
- Follow the procedure in the lab review lecture to see, whether you can fit a time constants to your data.
- If you encounter problems with this, you must check in with Dr. Gerken to decide, whether this has something to do with your analysis or with your data.
- For the next steps, only work with the shared LabQuest data:
- Fit exponential functions to each dataset and determine time constants and response times.
- Create a table showing time constants for each probe and direction. Estimate the uncertainty of the time constants from your data. Show all trials.
- Discuss the following questions:
- Were the time constants the same in each direction (i.e. cold-to-hot vs hot-to-cold)? Was there any evidence of hysteresis?
- How do your measured response times compare to the specifications provided by the manufacturers? (see spec sheets)
- Why are the reported time constants (see spec sheets) different for air versus water?
- Discuss advantages and disadvantages of high and low sampling rates and how this might relate to experimental errors and measurement uncertainty.
Part II:
- Create a graph showing voltage vs. temperature for the thermocouple that includes a measure of uncertainty for the obtained measurements.
- Include your table with all raw data into the report
- Calculate the sensitivity of the thermocouple using your best estimate for the voltages at T2 and T1.
- Answer these questions:
- Estimate the value of your body temperature using the calibrated thermocouple.
- Compare your measurement of body temperature to the average body temperature of an adult. How do they compare?
- What is the effective resolution of your calibrated sensor?
- Can you think of potential issues, if you were for example to use this calibration curve to estimate the temperature of an oil fryer (\(\sim 220\,^\circ\)C)?
- What errors and sources of uncertainty in your measurements do you identify? Which of these do you think is most likely responsible for any differences between measured and expected body temperature? Explain.
- Discuss the answers to the questions in your discussion section without copying the questions verbatim.
- Review the lecture materials about the importance about choosing appropriate models and curve fitting.
- Discuss importance of calibration for measurements in general and how it applies to this lab.
- Make sure to discuss sources of uncertainty and error
| Revision | Description | Author |
|---|---|---|
| 2026-02-05 | Added more programming tips | Tobias Gerken |
| 2025-02-12 | Harmonized calibration with lecture content | Tobias Gerken |
| 2025-02-04 (S25) | Update to use RPi for measurements rather than LabQuest | Tobias Gerken |
| 2024-02-05 (S24) | Updated to Web, Clarification of deliverables, added procedures for sampling rate and data download | Tobias Gerken |
| Initial Version | Chris Bachmann |