Lab 6: Evaluating Solar Panel Performance
Purpose
The purpose of this laboratory exercise is to apply your knowledge of instrumentation and measurement science for data-driven decision-making. In this lab, you will evaluate two different solar panels that have the same specifications from the manufacturer. You will use the performance data, in conjunction with cost factors, to make a recommendation and decide which of the two manufacturers should get the contract for the procurement of additional items.
Learning Goals
The goals of this Lab are to:
- Review circuit concepts to physically connect measurement hardware to a solar panel
- Apply instrumentation and measurement concepts to obtain voltage readings (and estimate uncertainty)
- Apply instrumentation and measurement concepts to obtain amperage readings (and estimate uncertainty)
- Calculate the average power production for the two solar panels being evaluated and provide an estimate of the combined uncertainty for each
- Employ a t-test to determine if there is a statistically significant difference in solar panel performance
- Evaluate the performance data in conjunction with cost considerations to make a recommendation for which solar panel manufacturer should receive the purchase contract (i.e. apply data-driven decision-making to make this recommendation)
Background
Solar energy is viewed as an attractive alternative to conventional energy production systems. As market demand has increased and production costs have decreased, solar panels are being deployed for a wide range of applications. As market share has increased, so has the number and diversity of solar panel manufacturers. Although solar panels from different manufacturers may have the same baseline specifications, variations in the raw materials and the production processes used for manufacturing the solar panels can yield varying on-site performance. Similar solar panels can also have very different retail costs, which further complicates the decision-making process. Large-scale consumers of photovoltaic panels employ measurement scientists to evaluate products from different manufacturers and evaluate products to facilitate data-driven decision-making by making purchase recommendations based on test results. In this lab, you will evaluate two different solar panels from two different solar providers. Each has the same basic specifications, but the cost differential between them is significant.
Dominion Power is planning to add 15,000 MW of new solar generation over the next 15 years.
Your goal is to evaluate the performance of these two solar panels under identical conditions and to use that data (along with cost factors) to make a recommendation to Dominion as to which solar panel manufacturer should be selected for future purchases.
Solar Panel for Evaluation
Figure 1 below shows two solar panels that will be evaluated during the lab.
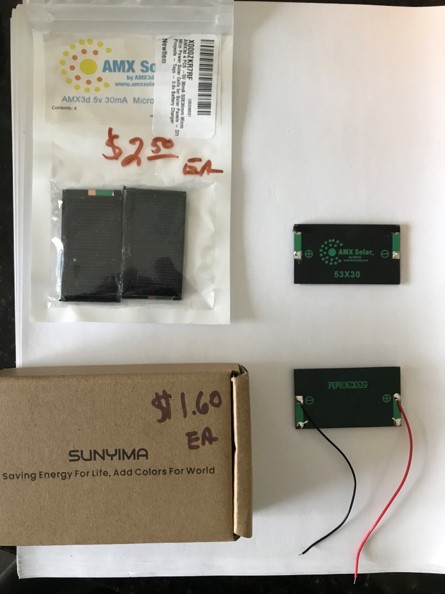
Although both the AMX and SUNYIMA solar panels are both rated at 5 volts, 30 mA the AMX panels cost 75% more. The AMX panels do not come pre-wired like the SUNYIMA panels do, even though they cost more. Actual performance and power production must be evaluated to make a data-driven decision as to which manufacturer should be selected for future purchases.
Methods – Evaluating Solar Panel Performance
This is the last lab that we are doing and we will be having an individual practical final.
It is highly suggested that every one of you practices the skills of this lab:
- Building a circuit on a breadboard
- Using the DMM to measure voltage and current
Connect the solar panels to the resistor and LED: Remember to connect the positive lead of the solar panel to the positive lead of the LED. The resistor must be placed in series to the led to limit current flow through the LED and prevent damage. To measure voltage, connect the DMM in parallel to the LED-resistor circuit and set the dial to measure DC volts (Figure 2). Place the setup in full sun (or under the lamp and avoid shading the solar panel). To measure current, connect the DMM in series with the LED resistor circuit and set the dial to measure mA (Figure 3).
Measuring Voltage: Connect the Digital Multi-meter in parallel and set the dial to read volts (DC). Notice the positive and negative leads of the DMM are on either side of the LED-resistor circuit. This does not allow current to flow through the meter but allows the measurement of voltage across the circuit.
TipNote that the image quality is low, at this point in the semester, you should be able to use the bread board to build a simple circuit without using the images.

Figure 2: Measuring Voltage in Circuit Measuring current: Connect the Digital Multi-meter in series and set the dial to read milli-amps. Notice the positive lead of the DMM is connected to the negative side of the LED and the negative lead connects back to the solar panel. This connection forces the current to flow through the meter where it can be measured.
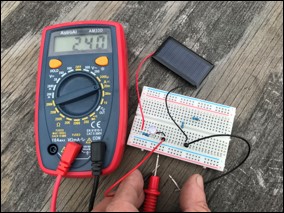
Figure 3: Measuring Current in Circuit Apply your knowledge of Instrumentation and Measurement Science to determine how many measurements you will need to get a good value for the average Power output for each solar panel.
Use Equation 1 to calculate Power based on your voltage and current readings:
\[P = IV \tag{1}\]
Provide an estimate of uncertainty. You will need enough measurements of Voltage and current to obtain \(\sigma_V\) and \(\sigma_I\). Then, calculate the combined uncertainty for your Power measurement.
use the t-test to determine if any performance differences are statistically significant.
Deliverable
Provide One (1) page summary explaining your findings and providing a final recommendation.
Show your work to get partial credit on the calculations!
Contents:
- Evaluate each solar panel. For each panel provide:
- Voltage:
- mean \(\pm\) standard deviation
- number of trials
- standard error of the mean
- Current:
- mean \(\pm\) standard deviation
- number of trials
- standard error of the mean
- Power (calculate \(P=IV\))
- mean and combined uncertainty
- Voltage:
- Perform a t-test to determine if there is a significant difference in the Power output of the panels. Report
- t-Stat (calculated)
- P-value
- Explanation of the experimental results.
- Differences in solar panel performance (if any).
- Include statistical significance
- Cost/benefit analysis:
- If one panel is performing better than the other, the additional value is related to the value of the electricity produced.
- Assume that consumers pay $0.11 per KWhr in Virginia.
- Differences in solar panel performance (if any).
| Revision | Description | Author |
|---|---|---|
| 2025-03-19 (S25) | Updates for clarity | Tobias Gerken |
| (S24) | Updated to Web and updates for clarity | Tobias Gerken |
| Initial Version | Chris Bachmann |