Lab 4: Part 1 - Measuring Distance with an Ultrasonic Sensor
Purpose
The purpose of this laboratory exercise is to become familiar controlling sensors with a computer and using the computer for data acquisition, processing, and control of physical systems. In this lab you will use an ultrasonic sensor to measure distance under the control of a Raspberry Pi computer interfaced through the General Purpose Input and Output (GPIO) pins. You will construct the circuit on a breadboard and write a Python script to control the sensor and record data locally. Minimum distance, maximum distance, sampling rate, and uncertainty will all be evaluated. In part II of the lab, you will use the Raspberry Pi to analyze the incoming data in real-time and activate an LED if an object comes too close to the sensor.
Learning Goals
The goals of this Lab are to:
- Review circuit concepts to physically connect measurement hardware to a computer
- Gain experience with General Purpose Input and Output pins (GPIO)
- Become familiar with Python programming used to control sensors and physical systems
- Investigate and evaluate measurement capabilities of a measurement instrument
- Calibrate the instrument
- Design experiments to determine maximum and minimum measurement values
- Design an experiment to determine the uncertainty associated with a measurement device
- Design an experiment to evaluate maximum sampling rates of the system
- Report your findings in a formal lab report
Background
Ultrasonic sensors are used in a variety of applications to accurately measure distances with relatively high sampling rates. They are used in advanced manufacturing to guide robotic systems involved in fabrication and delivery systems. They are also used on modern automobiles for collision avoidance and autonomous driving. Accurate, reliable distance measurements are essential in these applications.
Of particular importance in these applications are the maximum distance they can measure, the minimum distance they can measure, the uncertainty of these measurements, and the maximum sampling rate that is possible (i.e. – if tracking objects at high speeds). Each of these parameters will be determined in this lab.
In part II of the lab, the sensors will be programmed to send an alert to the operator and activate an LED if an object comes too close to the sensor. This will be done to simulate Autonomous Vehicle applications of ultrasonic sensors that are used in collision avoidance and navigation by activating steering and braking systems.
The Raspberry Pi is a small, inexpensive ($35) computer that was originally produced in 2009 by the Raspberry Pi Foundation to help teach students basic computer science. It was originally intended to help developing nations that could not afford computers.
The original release became extremely popular all over the world because of the low cost and high flexibility. Raspberry Pi’s are commonly used in robotics because of their Serial Peripheral Interface (SPI) and General Purpose Input and Output pins (GPIO) that enable easy communication with external sensors and controllers. I2C and UART communication protocols are also supported by the Rpi, allowing even greater diversity in connecting to external devices. In addition, the RPi provides several 3.3V and 5V power out pins that can be used to drive external electronics. The pinout diagram for the Raspberry Pi model 4B is shown below (Figure 1):
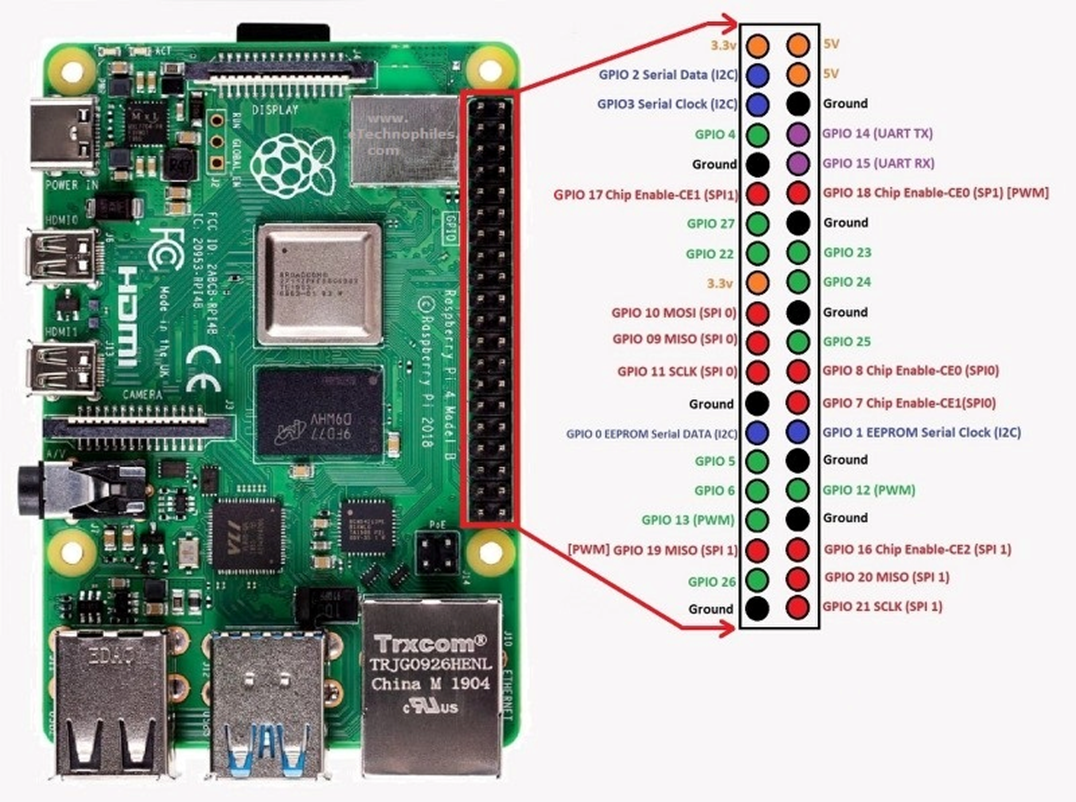
GPIO = General Purpose Input / Output –used to connect external devices (we will use these in this lab). Any of the pins with GPIO designation can be used to send and receive signals with the ultrasonic sensor.
Other protocols supported by the Raspberry Pi (these use specific pins shown on the diagram above):
- SPI 0 = Serial Peripheral Interface – used to connect external devices (different protocol than GPIO)
- I2C = Inter-Integrated Circuit – used to connect external devices (different protocol than GPIO)
- UART = Universal Asynchronous Receiver Transmitter - used to connect external devices.
- a different protocol from GPIO
- TX = transmitter RX = receiver
Materials
- HC-SR04 5V Ultrasonic Sensor
- Raspberry Pi 4B
- Breadboard
- Connecting wires
- 1x and 1.5x resistor (100/150 Ohm, 1k/1.5k Ohm, etc)
- LED (and resistors – for Part II of the lab)
- Tape measure
Procedure
1. Hardware connections
Physical connection of HC-SR04 Ultrasonic Sensor to the Raspberry Pi will be done with the use of an electronics breadboard. The ultrasonic sensor needs to be powered by 5V for accurate measurements, but the Raspberry Pi input voltage from the sensor cannot exceed 3.3V (or else risk damaging the computer).
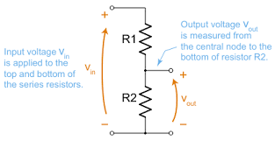
To accomplish this connection, the Ultrasonic Sensor will be connected to the 5V power supply of the GPIO, but a voltage divider will be established on the sensor output to reduce the sensor output voltage.
To do this, a voltage divider circuit will be built on the breadboard as shown in the diagram, essentially splitting the sensor output signal between the RPi and ground.
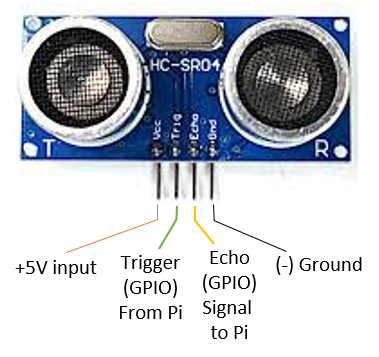
The diagram to the left shows the specific pins for the HC-SR04 Ultrasonic Sensor. It is driven by +5V power. The returning Echo signal to the Pi must be reduced from 5V to 3.3V to avoid damaging the computer. This is done with a voltage divider circuit using 1x and 1.5x resistors (Figure 2)).
You must have your wiring checked by an instructor before powering up!
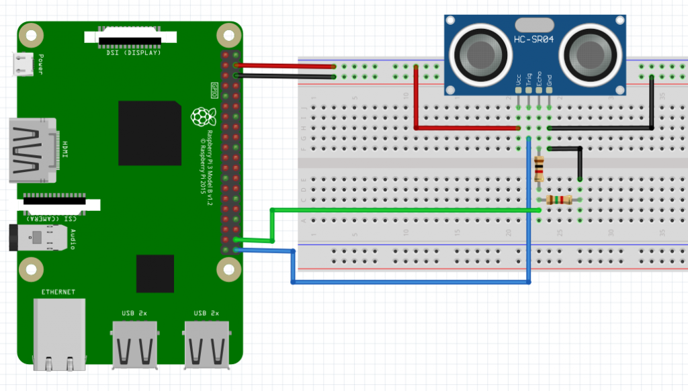
The diagram in Figure 3 shows the Trigger output connected to GPIO 21 and the Echo input connected to GPIO 20. The diagram shows the ultrasonic sensor facing upwards, but this is just for display reasons. To make measurements, you should connect the ultrasonic sensor to the board in such a way that you don’t have to bend any pins and that the emitter and receiver are facing outwards.
Make sure that you are connecting the wires to the correct port of the Ulta-sonic sensors. Make sure the names in the drawing and on the actual sensor match up. The emitter and receiver of the sensor should face outwards and be free of any obstruction.
Note that: ANY of the GPIO pins can be used; you simply need to match the Python programming (software) with the wiring (hardware).
2. Software connections
Keep your code and data organized on the Raspberry Pi:
- Create a new folder
ISAT300_L3 - Make sure to save your program into that folder
You will use Python code to connect the RPi with the ultrasonic sensor. Making this software connection enables you to read measurements from the sensor to the RPi, to display the data on the screen and to write the data to the file.
Turn on the Raspberry Pi and open the Thonny Python Integrated Development Environment (IDE).
You can download starter code from my GitHub.
You can simply copy and paste the code into the Thonny IDE.
Take a look at the starter code, it can be separated into 3 sections.
- Setting up the GPIO input/output pins (Lines 1-14)
- Distance measurement function (Lines 14-40)
- Conducting and displaying the measurement on screen (Lines 42-46)
Let’s look at these in more detail. We go through the code line by line to help you understand what it does.
It might be a good idea to take some time here at home to read this very carefully.
Step 1: Setting the GPIO input/output pins
These first 14 lines of code setup the RPi and specify the input and output pins that will be used to connect to the ultrasonic sensor. Here, the Trigger is set to 21 and the Echo is set to 20 – but any of the GPIO pins will work. We will test that later in this lab.
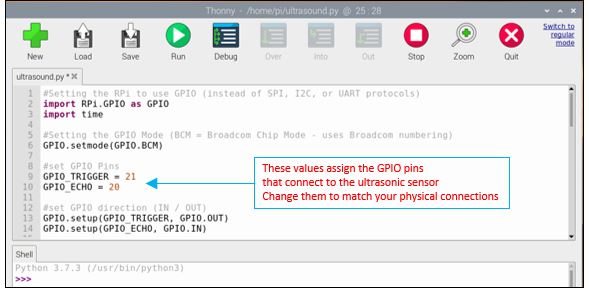
Notice that some of the lines of code appear in a light-grey color. This means that they are non-functional lines of code (i.e – they don’t do anything!). These non-functional lines of code are used to help programmers know what is happening in each section. To add notes to the code you are writing, or to disable a line of code without deleting it, simply put a “#” symbol in the first space.
- Line 6:
GPIO.setmode(...)tells the RPi to use GPIO, then to use the Broadcom Chip numbering for the GPIO - Lines 9-10: Set the specific pins for the Trigger and the Echo signals.
- Lines 13-14: USe the
GPIO.setup(...)command to specify that the Trigger pin serves as an outputGIPO.OUTfrom the Pi and the Echo serves an inputGIPO.INto the Pi (i.e. the response from the sensor).
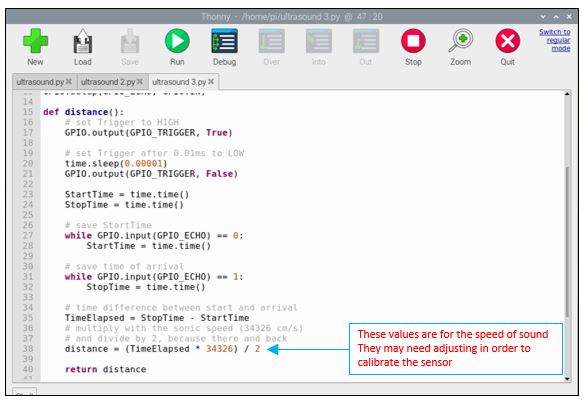
Step 2: Distance measurement function
To conduct a distance measurement, we need to define a procedure that activates the sensor and uses information from the sensor to derive a distance.
Lines 15-40 will do that by defining a python function called distance(). Recall from your programming class how functions work. Functions are snippets of code that can be executed over and over and that will perform a bunch of operations. At the end they return a value, which in this case is our measurement variable (distance). The operating principle of this sensor and the code is explained well on this website.
What the distance() function does is a bit complicated and we go through line by line:
Line 17 sends a signal from the RPi to the Ultrasonic sensor to activate it. Setting the
GPIO_TRIGGERtoTruesends a voltage to sensor, causing it to transmit ultrasonic waves.Line 20 allows the Trigger signal to continue for 0.01 milliseconds (0.00001 seconds)
Line 21 turns off the
GPIO_TRIGGERsignal, shutting off the acoustic waves.Lines 23-32 are used to monitor signals coming from the ultrasonic sensor to the RPi. As soon as the sensor emits a sound signal, it will start listening for an Echo signal.
Lines 23 and 24 set our variables for StartTime and StopTime using the RPi’s internal clock.
Lines 27 and 28 log the StartTime as the time when
GPIO_ECHObecomes active.
As soon as an Echo signal is received by the ultrasonic sensor, the
GPIO_ECHOis switched to inactive and the time is recorded by lines 31 and 32 of this Python code.Line 35 calculates the time between when the Ultrasonic signal was first detected and when it ends, which corresponds to the total travel time
Line 38 calculates the distance between the Object and the Sensor. Sound travels at a speed of 34326 cm/s (at sea level). Multiplying this velocity \(\times\) time yields a distance. It is divided by two because the ultrasonic signal goes
- from the Sensor to the Object and
- the Echo returns from the object to the sensor.
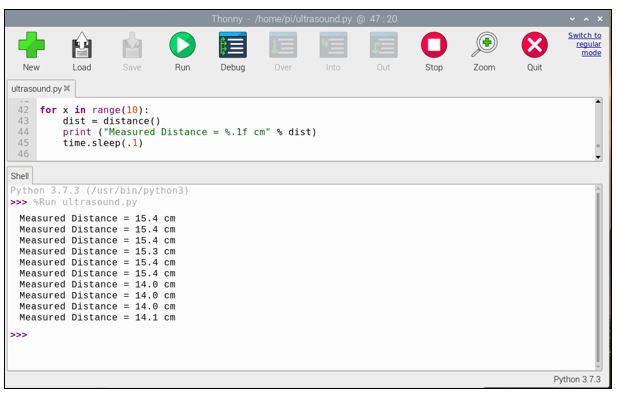
Step 4: Printing the measured distance on the screen
With the distance measurement function defined, we can now conduct our measurements using a python for loop
Line 42 of the code shows a for loop that will record 10 samples. In each iteration of the loop, the
distance()function is called and returns a measurement that is saved to a variable. You can change this value to reflect the number of samples you wish to take (100 samples would be very good to calculate Mean and Standard Deviation, for example).Line 44 prints the distance measurement on the screen. The
%.1fis the placeholder for the variable, which is replaced by the stored distance measurement (dist) at the end of the line.- Note: the
.1fdefines the format of the number with 1 decimal point.
- Note: the
Run the code at this point to test that everything is working properly (click the Run icon at the top of the screen).
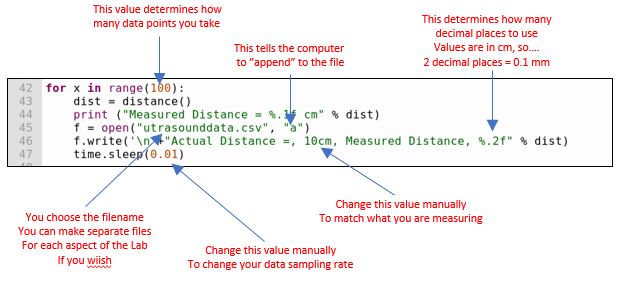
Step 4: Writing the data to a .csv file.
- Please make sure to save the program every time you make a change! Create copies of the program if needed.
- Your data will be appended to a csv-file. If you want save your data into several files, you can modify the filename as needed.
In order to conduct experiments evaluating the performance of the ultrasonic sensor you will need to collect a significant amount of data. For all values in questions (Calibration Curve, Maximum Distance, Minimum Distance, Fastest Sampling Rate, and Standard Deviation) we are asking you to collect 100 data points. This is far too much to write down by hand.
Comma-separated Variables (or .csv) files can be opened by numerous software packages to perform data analysis.
Modify the data collection loop using the below lines to to create a .csv file and write ultrasonic distance measurement to it. Embed the code in the for-loop so that the data is simultaneously presented on-screen and written to the .csv file.
    for x in range(100):
        ...
        print("Measured Distance = %1.f cm" % dist)
        f = open("ultrasounddata.csv", "a")
        f.write('\n' + "Actual Distance = , 10 cm, Measured Distance , %.2f" % dist)
        f.close()
        ...
The f = open() line opens a .csv file. If the file does not exist, it will be created. You can name the file whatever you like, but it must have the .csv ending. Notice the “a” at the end of the line - this tells the computer to append the file – i.e. – it won’t overwrite the file or start over; it will add new data to whatever is in the file.
The next line f.write() actually writes the data to the .csv file given the provided format: The first part ‘\n’ tells the computer to start a new line. You will need to manually adjust the Actual Distance to match your measurements.
The f.close() line closes the file object.
Conducting the Experiment
Your team will need to design an experiment to do the following:
Keep a record of your methods!
Correct the sensor: Use at least 5 different distance measurements to check your Ultrasonic Sensor.
TipDo this first!
- Select 5 distances and compare the sensor output to your measured distance.
- Graph your results with:
- x-axis: Correct Distance
- y-axis: Measured Distance
TipHow do you take the repetitions of the distance measurements into account?
- Fit a linear trend line to your data and find the slope (=Sensitivity) as well as any offset (Bias)
- Is there a bias? And how do you think it relates to from where the sensor is measuring?
If the sensor is not providing the correct readings, adjust the Python code accordingly.
Determine the Maximum distance this sensor can measure:
- Write down your methodology
- What did you notice, when finding the distance the sensor can measure
- Calculate a Mean \(\pm\) S.D.
Determine the Closest distance this sensor can measure.
- Write down your methodology.
- Calculate a Mean \(\pm\) S.D.
What is the uncertainty in this measurement system? Use at least 100 data points in each location to determine the measurement uncertainty for this Ultrasonic Sensor System.
What is the fastest you can accurately sample data with this system? Many factors contribute to the speed of this system, including the timing you set in the Python code, the speed of the processor, the speed of the memory card, the distance the sound has to travel from the sensor to the target, etc. The speed of incoming data is critical to Autonomous Vehicles.
Use a moving object to help you design an experiment to determine how fast you can actually measure something with this system. Provide an estimate of your uncertainty in this measurement.
Deliverables:
You will submit a full lab report after the second part of this lab.
For this week, submit
- A formulated research question or hypothesis
- Your lab notes regarding methodology
- A sheet with all data
- A figure showing your results for 1)
Acknowledgements
This Lab was designed by Dr. Chris Bachmann. Special thanks to Joe Rudmin for helping secure necessary equipment and for providing lab support.
| Revision | Description | Author |
|---|---|---|
| 2026-02-13 (S26) | Clarification on distance() function | Tobias Gerken |
| 2025-02-14 (S25) | Minor changes (spelling) | Tobias Gerken |
| 2024-02-16 (S24) | Added notes to methodology | Tobias Gerken |
| 2024-02-12 (S24) | Updated to Web | Tobias Gerken |
| Initial Version | Chris Bachmann |