flowchart LR
  A(Environmental Issue) --> B(Specific Question)
  B --> C(Data Analysis Workflow)
  B1[Environmental Data] --> C
  C --> D(Product)
5. Data Analysis
Motivation
Specific learning goals
Concepts:
- Differentiate between structured and unstructured data
- Describe the features of tabular data
- Understand the basic syntax of pandas to read, manipulate, and plot tabular data
- Realize the utility of pandas in the data analysis workflow
Skills:
- Use GitHub and GitHub-Desktop to update the shared code repository
- Use Anaconda and Jupyter notebooks to execute Python
- Pandas:
- access data in
SeriesandDataFramestructures - calculate descriptive statistics on data
- read tabular data (e.g:
*.csv) into pandas - merge data from different sources into a single
DataFrame - select data based on conditions
- use pandas plotting functionalities to visualize data
- access data in
Recap: Framework for approaching environmental issues
Focus on Environmental Data
Data structures
- Structured Data is data that has a clear structure that can be used for analysis. You are probably familiar with this type of data. For example, when you open an Excel sheet, the data in this sheet is structured as a table with rows and columns. Traditional data analysis methods are great for working with structured data.
- Unstructured Data is data that does not follow a pre-defined data model. Examples of these are collections of text, images, movies, … Such data is very difficult to process using traditional data analysis techniques.
Tabular data
- Any data that can be arranged in two-dimensions.
- Main convention:
- columns = features
- rows = values
- Examples:
- Weather station: e.g. measurements of temperature and precipitation as a time series
- Ecological data: e.g. sampled trees with species, width, height, …
- Common data format: Excel files, CSV (comma separated values)
Features of environmental data
- Environmental data can be messy
- Environmental data tends to be place based
Therefore:
- Need for meta data (We need to know how the data was collected)
- Need for exploratory data analysis (We need to understand the data)
- Need for data cleaning (Remove outliers, etc)
Analyzing Tabular Data
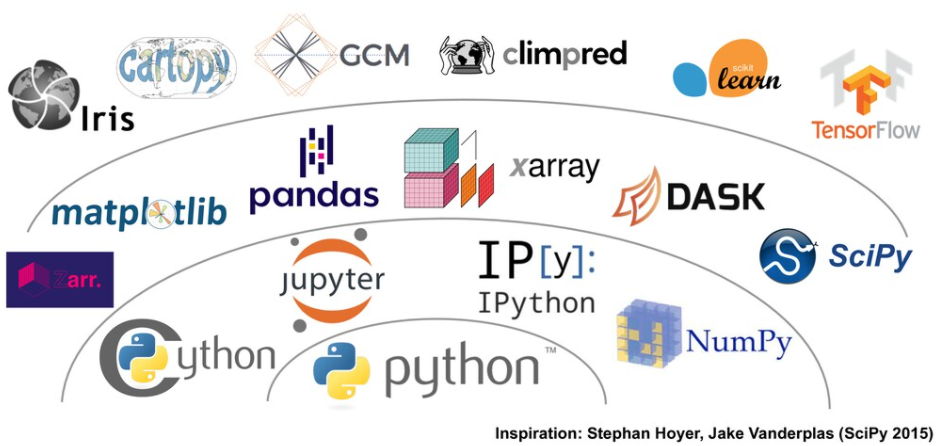
We have already encountered the first two layers of the Pangeo ecosystem: Python and jupyter. We are now adding another layer with pandas.
Pandas
According to Abernathy (2021):
Pandas is a an open source library providing high-performance, easy-to-use data structures and data analysis tools. Pandas is particularly suited to the analysis of tabular data, i.e. data that can can go into a table. In other words, if you can imagine the data in an Excel spreadsheet, then Pandas is the tool for the job.
Pandas is a Python package that can be used to process tabular data. Here are some features:
- Tools for reading and writing data between in-memory data structures and different formats: CSV and text files, Microsoft Excel, SQL databases, and the fast HDF5 format
- Aggregating or transforming data with a powerful group by engine allowing split-apply-combine operations on data sets;
- Aggregating or transforming data with a powerful group by engine allowing split-apply-combine operations on data sets;
- Capabilities for creating many different plots (scatter, histogram, boxplots, …) using matplotlib.
ImportantGetting updates to the data analysis/ lecture code
- Every week, I will be added new code, data, and examples to the shared course repository (
ISAT_420_S26_Shared). - Because you will be working with your
forkedcopy of this shared repository, you have to pull in and merge these changes into your own repository. - We can do this using GitHub-Desktop (See here)