Lesson Plan for Week 5
Objectives
We have now started to work with tabular data in Python using pandas. This week, we will expand on this to think about this in a more systematic way. I will also introduce you to two very powerful features in pandas.
- Working with timseries data
- Using groupby to aggregate data
We will also be defining some semester topics that you will then get started to work on.
We also have the first learning reflection coming up. I will introduce this in class.
Specific learning goals
- practice Git/ GitHub workflows to retrieve, update, and share data analysis code
- learn how to read tabular data into Python using pandas and jupyter notebooks
- perform exploratory data analysis
- use pandas methods to analyze data with respect to specific questions (e.g. groupby, timeseries change)
Class Preparation
We continue to practice the workflows. You should be familiar with getting ready to work:
- Have jupyter and github-desktop ready
- Be able to pull in new code from the shared repository
- Be able to locate and open jupyter notebooks (
*.ipynb)
Readings
Tools
We are starting to use Python for data analysis. For reading and exploring tabular data, we will be using the pandas library.
The Abernathy (2021) textbook has two chapters that are worth reading as a reference. These are also the notebooks that our in-class activities are based upon.
- Python Fundamentals
- A refresher on the basic features of the Python programming language.
- Basic Pandas
- An introduction to pandas
SeriesandDataFramesas the basic organizational structure and how these can be manipulated and processed for doingexploratory analysisandplottingof data.
- An introduction to pandas
Background: NOAA Weather Station Data
The Global Historic Climatology Network (GHCN) is “is an integrated database of daily climate summaries from land surface stations across the globe. … GHCNd contains records from more than 100,000 stations in 180 countries and territories.”
Data for all U.S. weather stations that report to the National Oceanic and Atmospheric Administration (NOAA), which also runs the National Weather Service are also found in an online searchable tool called: Climate Data Online that allows you to find U.S. stations and their data through a web-interface.
Below (Figure 1) is an example for the station description page for the station located near JMU: Dale Enterprise.
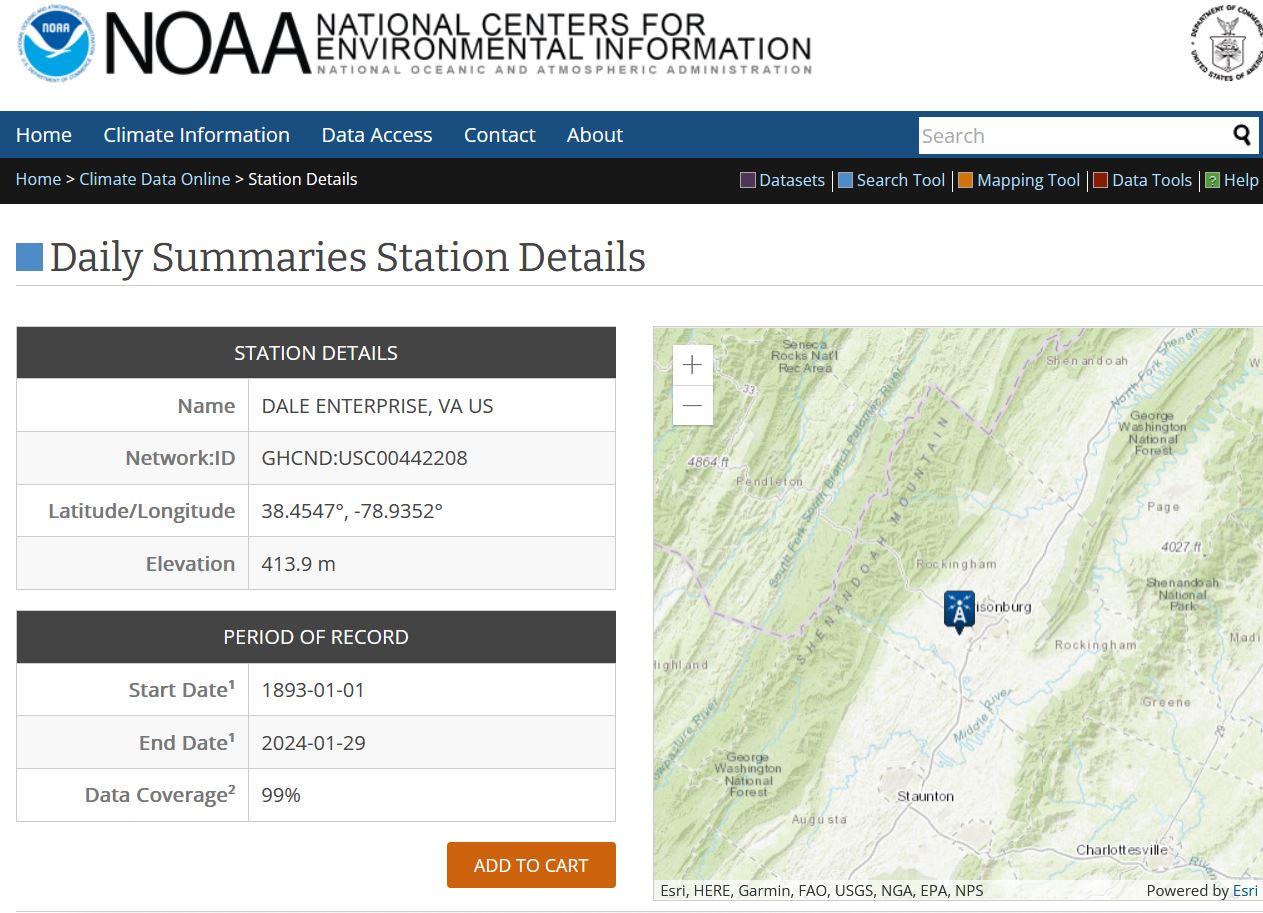
If you go to the station website, you can not only see, what weather variables are being recorded, but also download the data and find information about station history, such as instrument and location changes … Such information is called meta data and can provide important context for interpreting the data.
Planned Agenda
Assignments
At the end of the week, you should also submit your first learning reflection. I will introduce this next week.