flowchart LR
  A(Environmental Issue) --> B(Specific Question)
  B --> C(Data Analysis Workflow)
  B1[Environmental Data] --> C
  C --> D(Product)
From Data to Models
Motivation
Specific learning goals
Concepts:
Skills:
Recap: Data analysis workflow
Here is a more detailed breakdown of the data analysis workflow:
- Data Collection: Gathering data from various sources, such as sensors, APIs, or databases.
- Data Cleaning: Preprocessing the data to remove errors, fill in missing values, and ensure consistency.
- Data Exploration: Analyzing the data to identify patterns, trends, and relationships between variables.
- ?
<We have not yet really talked about this yet>? - Communication: Presenting the findings in a clear and concise manner, using visualizations and reports.

It is important to understand what these missing steps are, to avoid being in the same situation as the underpants gnomes in South Park (Figure 2).
Models
Whenever we use data to understand a scientific process or environmental issue, we are essentially building a model. A model is a simplified representation of reality that helps us represent, understand, and predict phenomena.
Models can be conceptual, where we use diagrams and verbal descriptions to represent the relationships between different components of a system. For example, we might have a conceptual model of the carbon cycle that shows how carbon moves between the atmosphere, oceans, and land.
Models can also vary in complexity from simple to very complex.

Types of models
- Statistical models: These models are based on statistical relationships between variables. They are often used for prediction and inference. For example, a linear regression model that predicts CO\(_2\) levels based on time would be a statistical model.
- Mechanistic models: These models are based on the underlying physical, chemical, or biological processes that govern a system. They are often used for understanding and simulating complex systems. For example, a mechanistic model of the carbon cycle would include the processes of photosynthesis, respiration, and decomposition.
Both models rely on data to be built and validated.
- Statistical models are built by fitting mathematical functions to data. They are then validated by comparing their predictions to observed data. A special case for this are machine learning models, which are a type of statistical model that can learn complex patterns in data without being explicitly programmed with a specific mathematical relationship.
- Mechanistic models are built by incorporating the known processes and interactions within a system. They are then validated by comparing their simulations to observed data.
For now we will focus on statistical models and will come back to modeling later in the course.
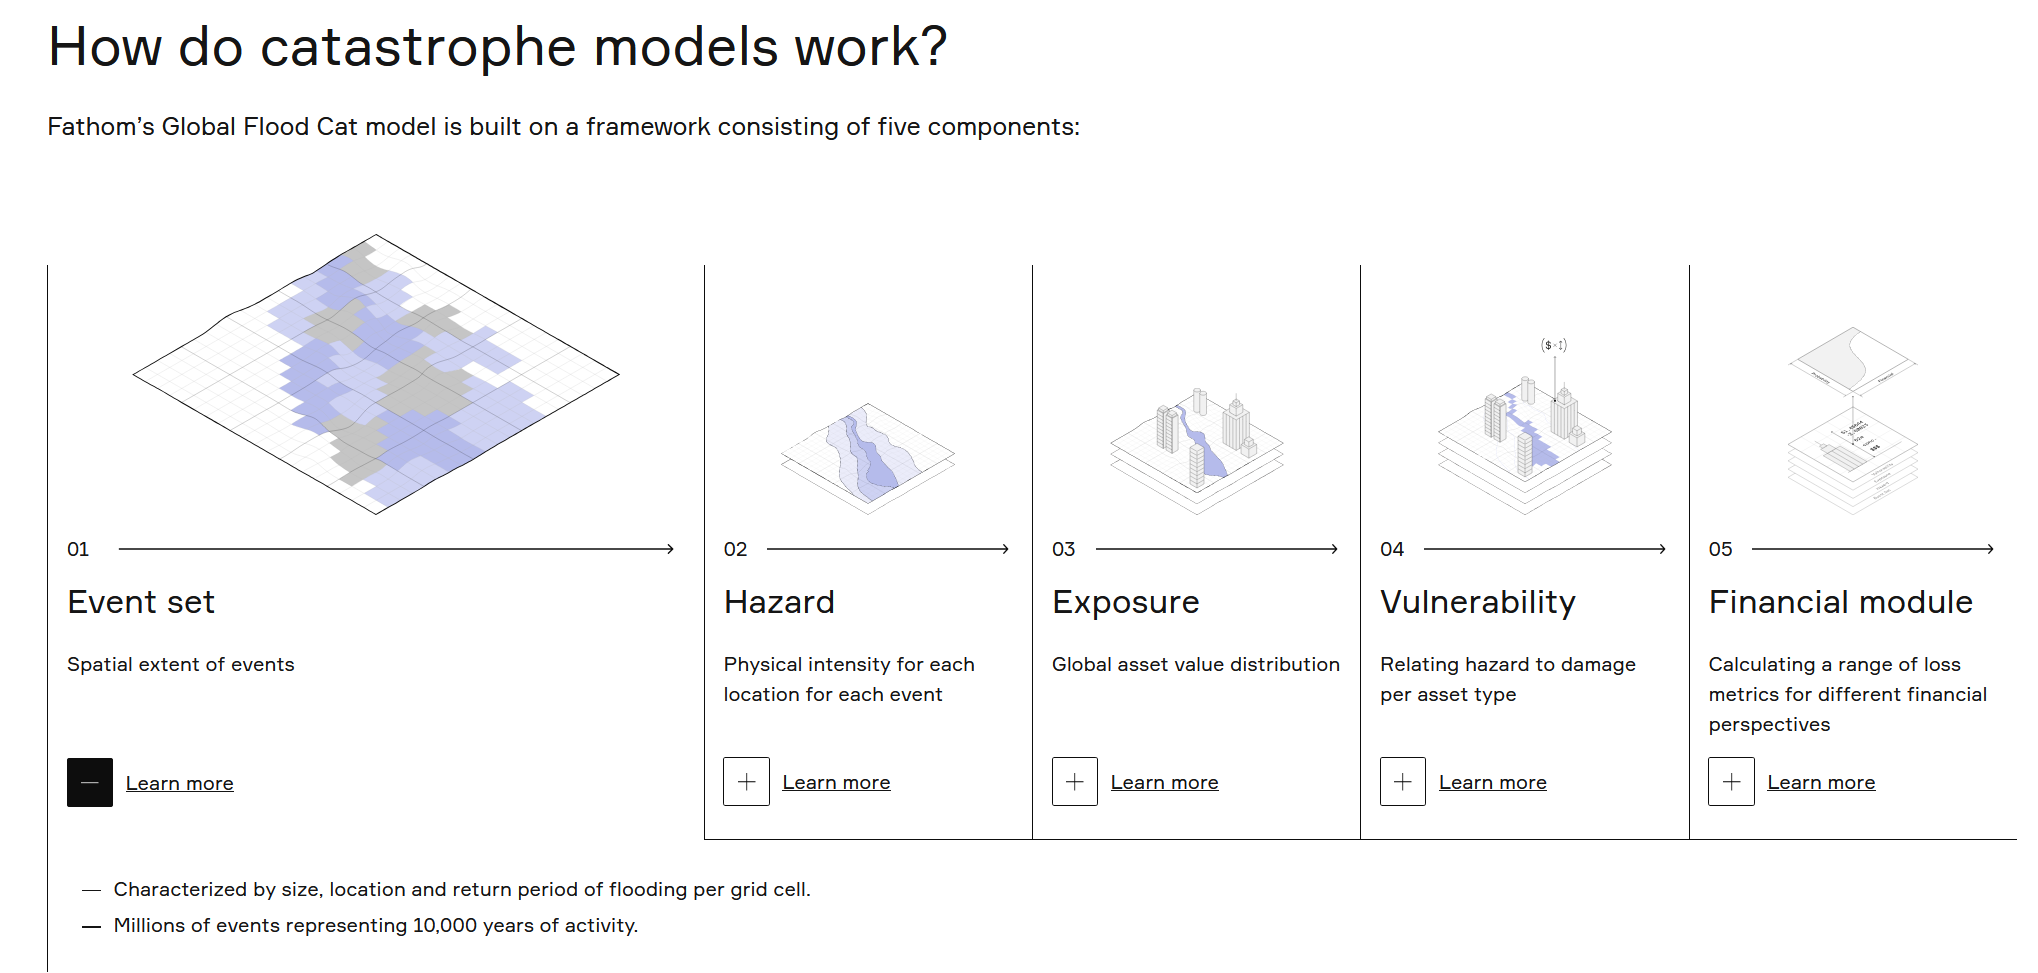
Case Study: Flood risk modeling
We will explore one specific statistical model in more detail: flood probability modeling.
Understanding flood return risk is very important for a variety of reasons, including urban planning, infrastructure design, and pricing insurance (Figure 5).
For example, we might want to know the probability of a 100-year flood event occurring in a specific location. This would be a flood event that has a 1% chance of occurring in any given year. To estimate this probability, we can use historical flood data to fit a statistical model that describes the distribution of flood events.
Infrastructure projects are often designed to withstand a certain return period flood event, such as a 100-year flood.
Similarly, insurance companies use flood return periods to set insurance premiums accordingly. Statistically, a house in a 100-year floodplain has more than 1 in 4 chance of being flooded during a 30-year mortgage.
Forecasting extreme events like floods is very difficult because of limited data. We can use statistical models to extrapolate beyond the range of observed data, but this comes with a lot of uncertainty.
You will see this in the following case study, using data from the USGS stream gauge at the South River, which has recorded streamflow data since 1952 (i.e. less than 100-years of data).