1. Getting Started
Introductions
Introduce yourself with
- preferred name & pronouns
- major
- do you prefer cats or dogs (must make a choice). Why?
- one environmental issue you care most about/ are most curious about
Course Objectives
Let’s have a look at the provisional course objectives from the syllabus:
By the end of this course, our goal will be for you to:
- Apply principles of open and responsible science to acquire, process, and visualize environmental data
- Understand different types of models and environmental data and how they can be used to characterize environmental issues
- Interpret environmental data to characterize causes and effects of environmental problems
- Evaluate complex environmental systems using computational tools to
- Understand causes and effects of environmental problems
- Realize limitations of data and models
- Effectively communicate scientific and technological information
- Analyze, present, and defend the results and conclusions from projects that involve environmental data from observations and models
What is this course about?
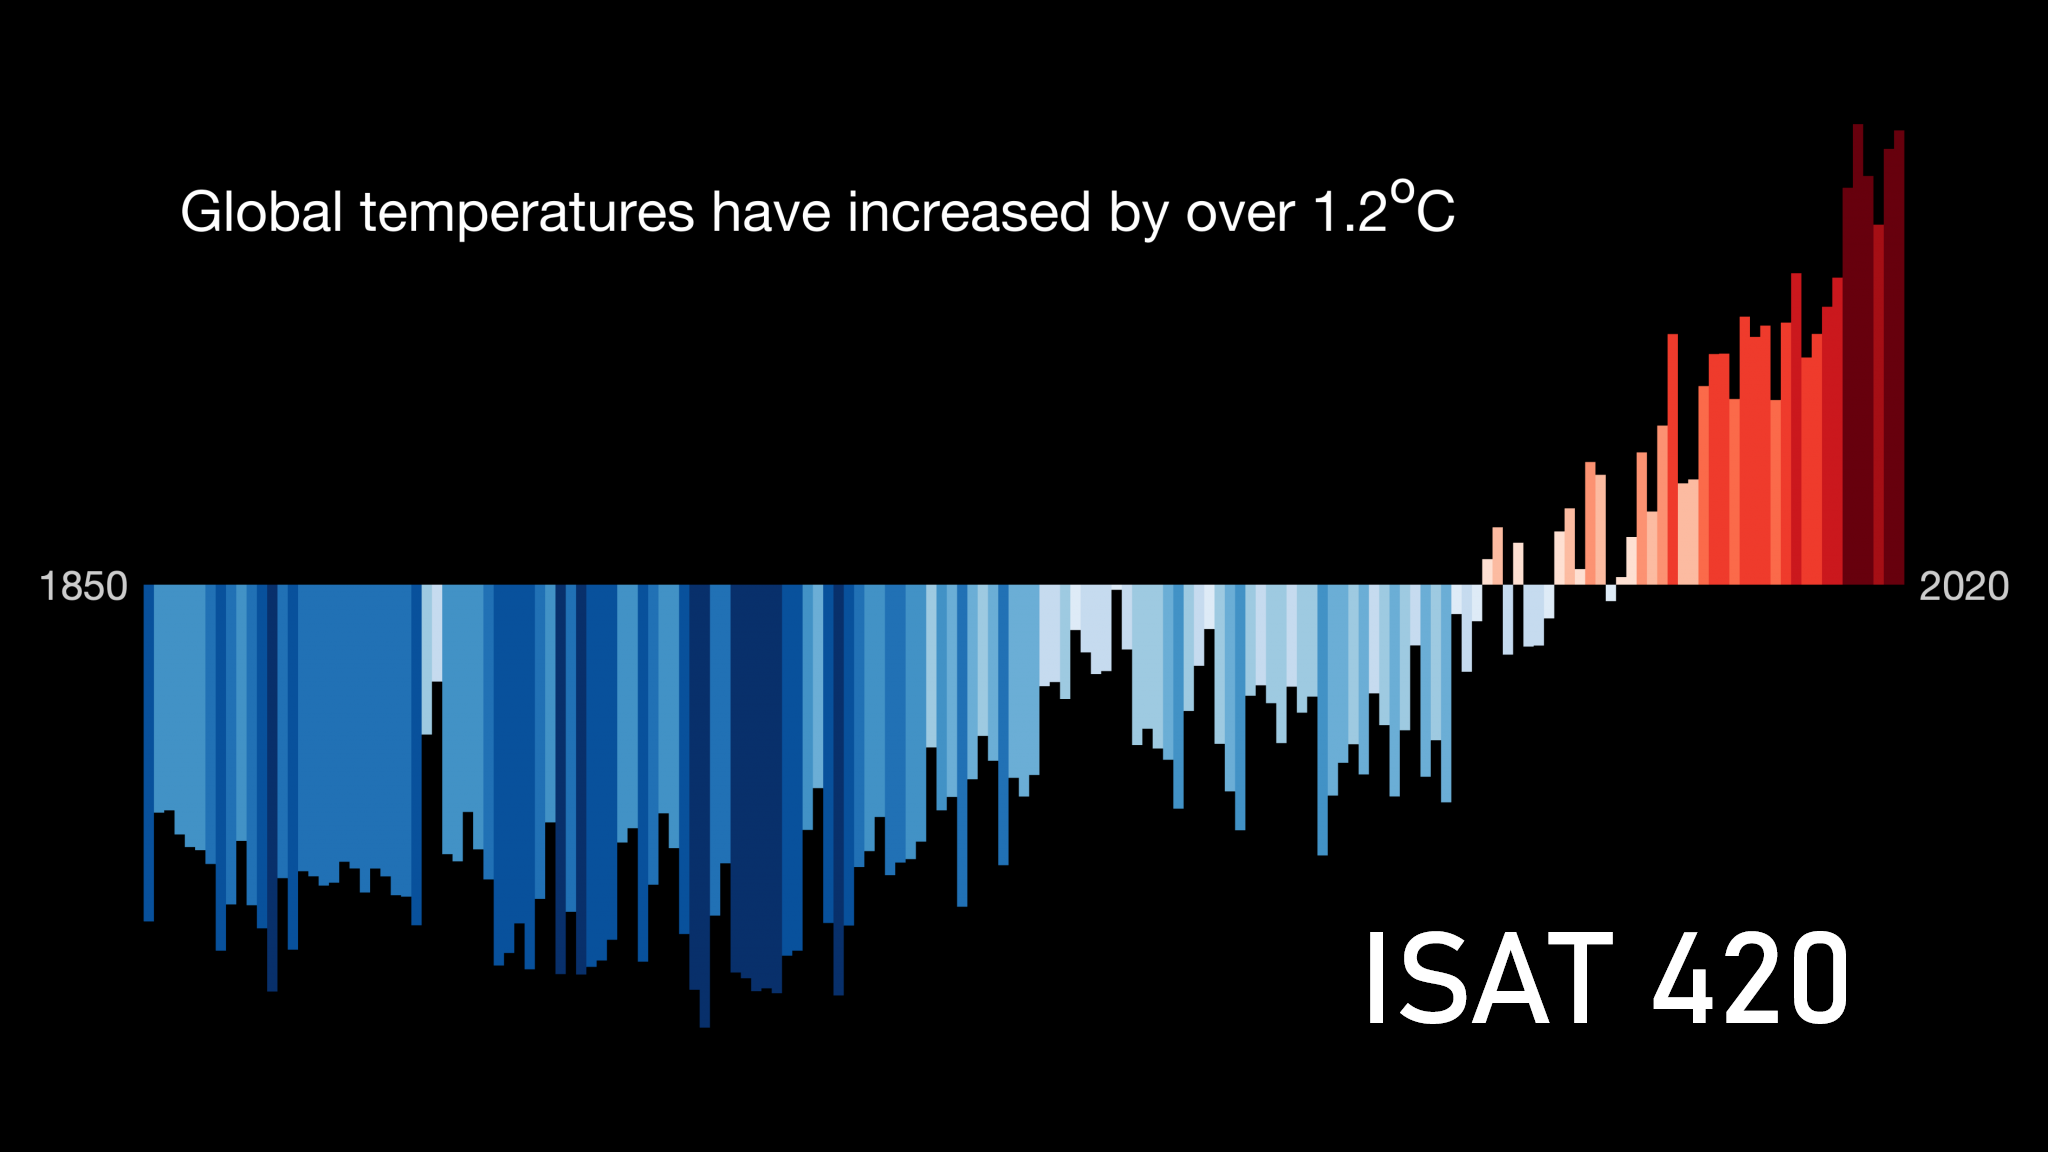
We have a lot of environmental issues that we need to understand and solve
There are also a lot of environmental data available to us (and steadily increasing)
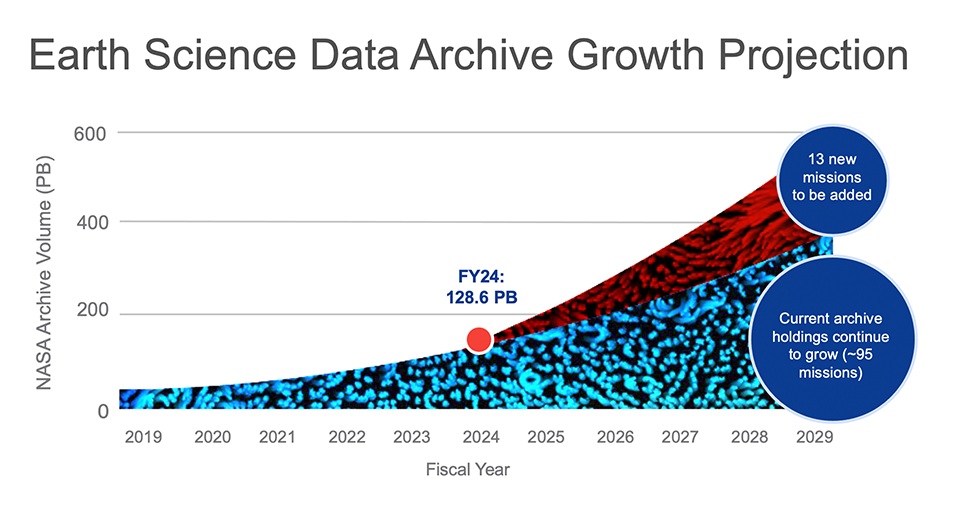
Volume of data archived by NASA; Credit: NASA EMS
Making this data useful to solve problems
Challenges
- Storing and processing this data
- Finding and accessing the right data to solve problems
- Understanding the story that the data tells us
This requires processes and workflows
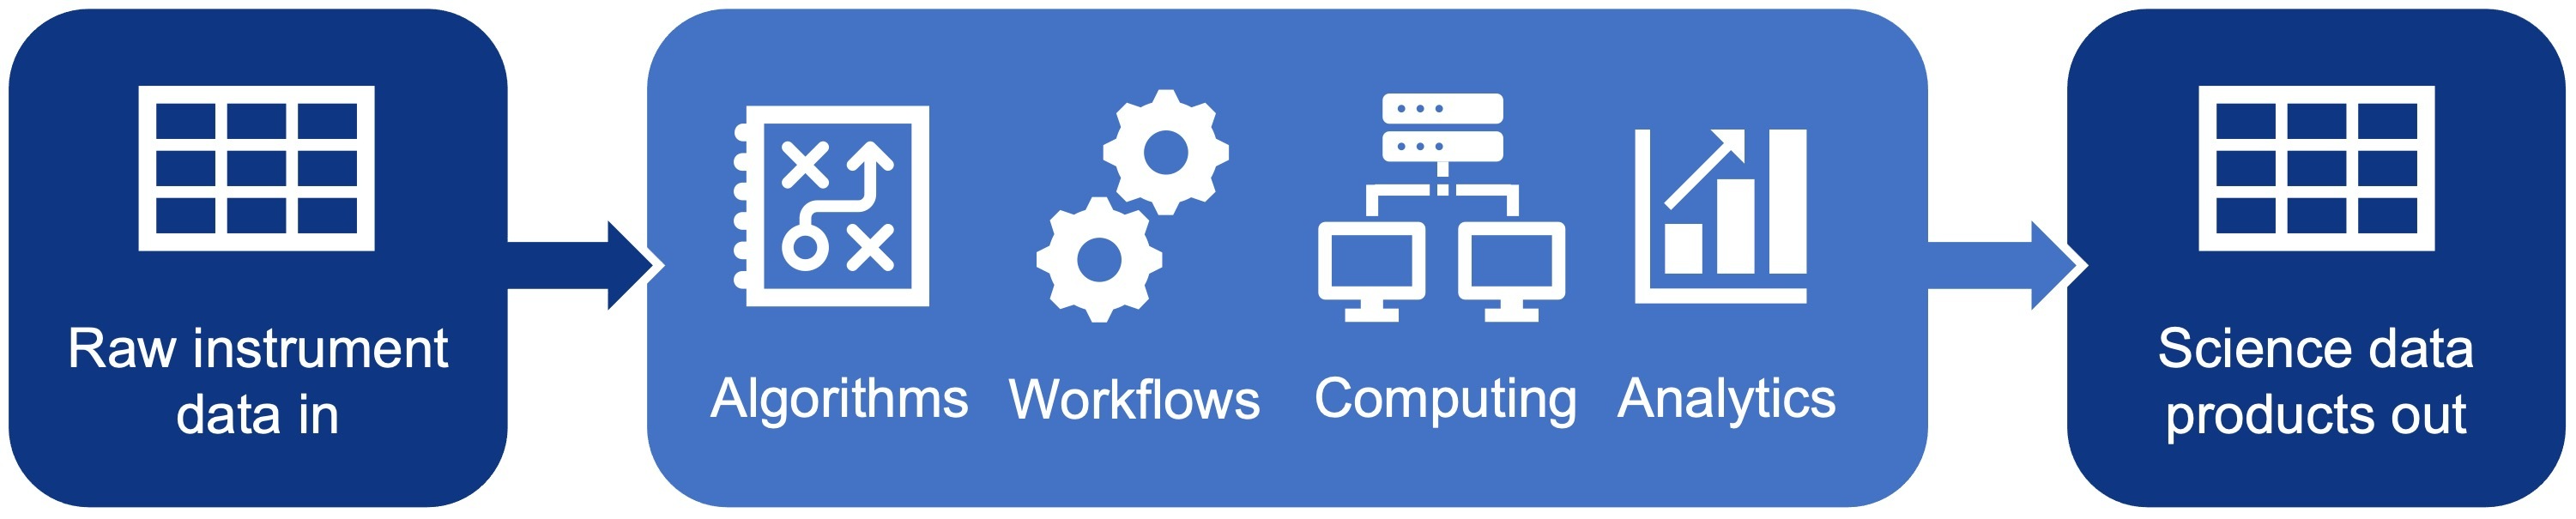
Basic NASA data processing flow - raw data is transformed into products; Credit: NASA EMS
We will try to model this in class
- Develop workflows
- Learn tools that help us do this
- Explore environmental datasets
- Explore environmental questions
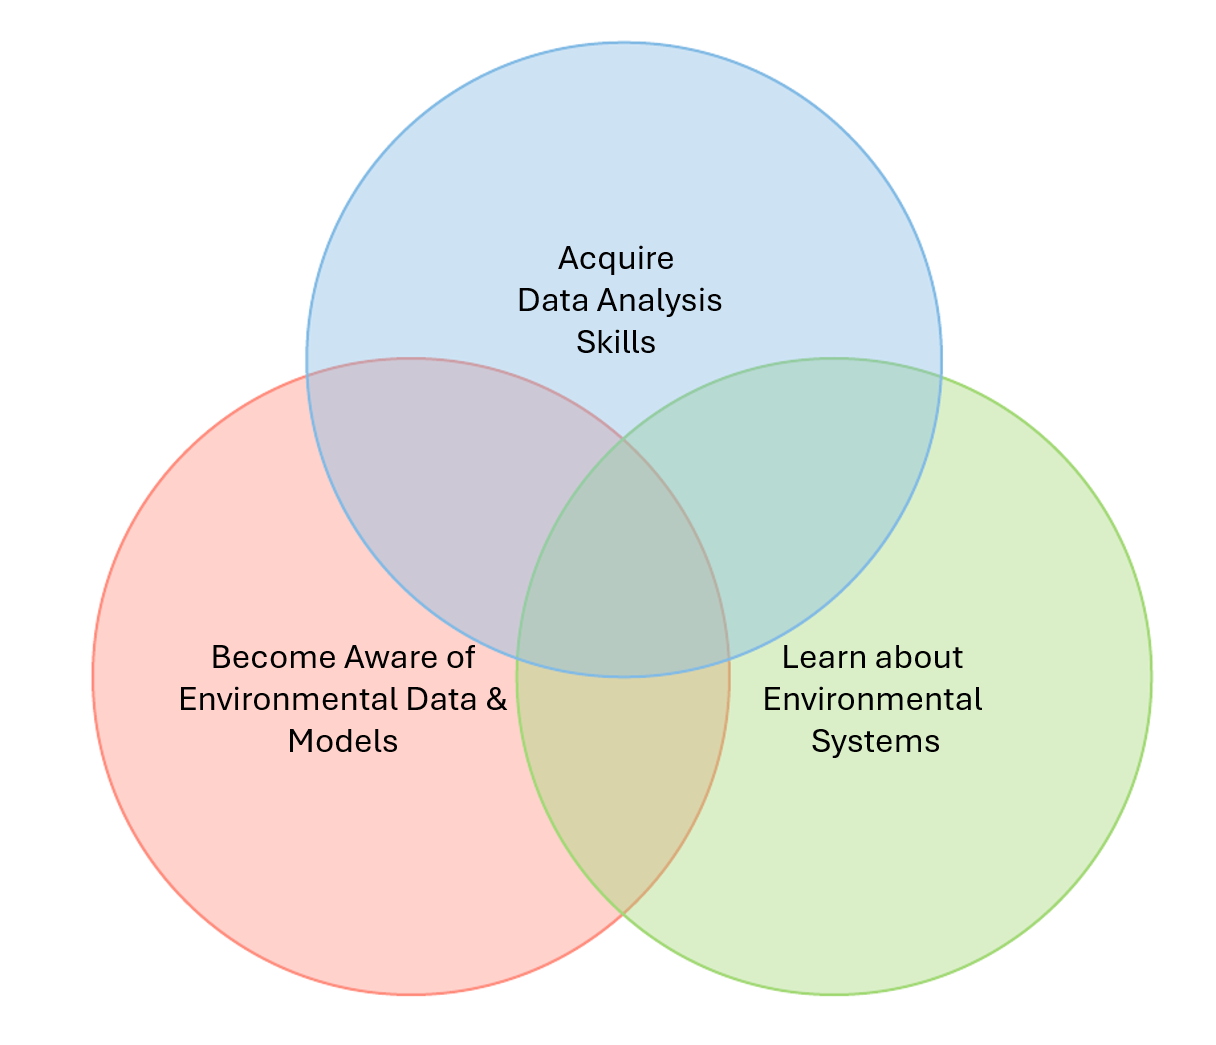
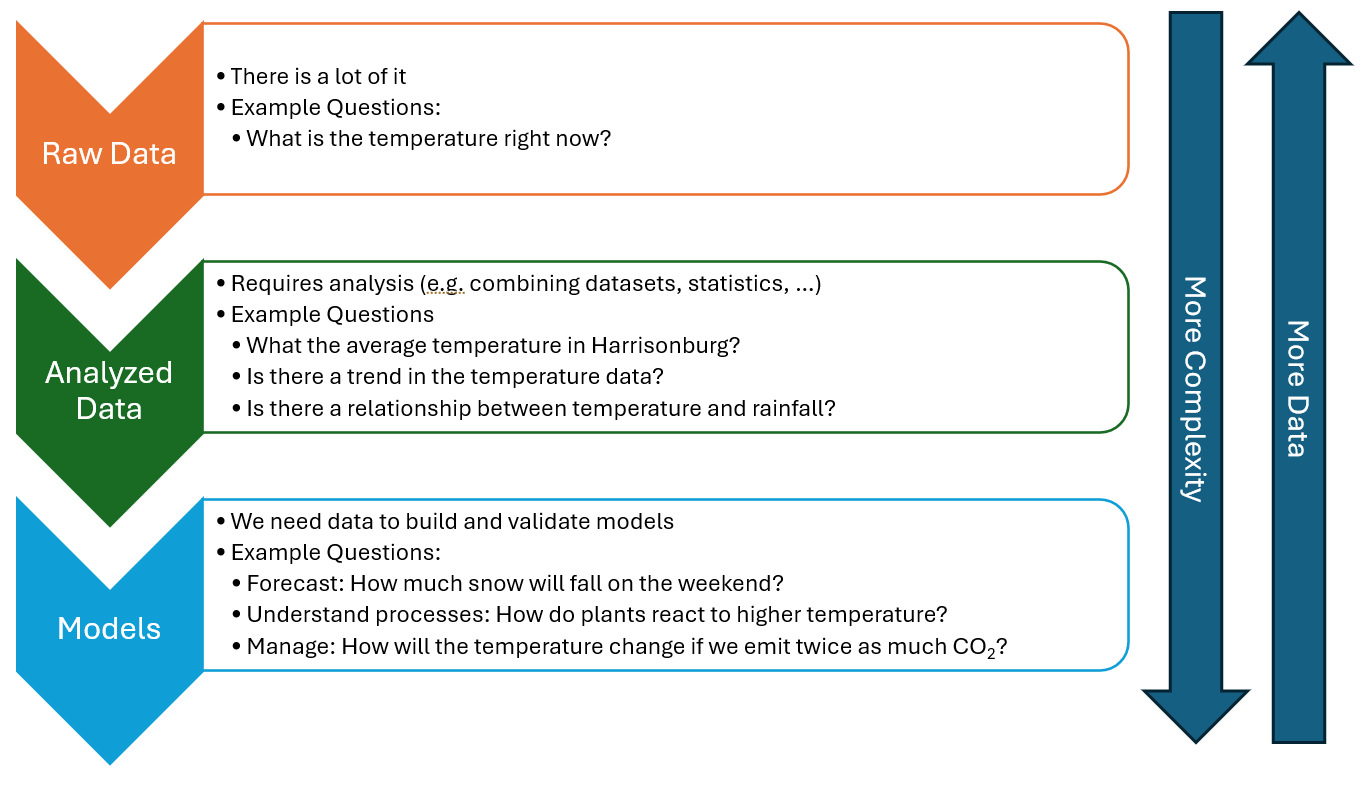
How do we relate data, models, and questions that we can ask
Class expectations
We will use a board to collect class expectations. Write down on a sticky note (1 idea per note) and place the notes on the board:
- What do you hope we learn in this class?
- How do we want to work together in this class?
We will review and discuss these at your table and within the group.
Syllabus & Schedule
Class expectations (Follow Up)
Discuss on your table: What specific steps can we take to:
- best work together in a team?
- have good class discussions?
How we work together
- Collaborative environment
- No quizzes/ exams
- Mixture of mini-lectures, code demonstrations, activities, guided coding
- Team coding:
- Work in pairs and discuss what you are doing
- Have at least one laptop as a pair
- The focus is on learning the process and not the results
- Ask me questions when you don’t know the Why or What
A note on AI (as team mate)
The focus of this class is on learning the process and to understand what you do and why
GenAI has become quite good at the basics (i.e. vibe coding)
Here is how I see AI
TipGood uses of genAI- Automate the boring stuff
- Do things that you know how to do
- Revise and clarify
WarningThis is the danger zone- use AI to learn new things
- AI can be used as a tutor, but you need to stay in charge
- cross-check output with reliable sources
- also do it on your own to make sure you can do it/ you understand
- make sure things are aligned with the course and the level of learning
ImportantBad uses of genAI- use to deceive (e.g. pass of AI output as your own)
- use AI to outsource thinking
- bypasses learning
- true learning needs friction and moments when you are not sure
- gives AI power to shape your thinking and personality
- what are your skills if AI can do it?
- use AI to shape human interactions
- …
Evaluation
Learning Journal/ Notes
Let’s review the syllabus portion on evaluation and the guide on crafting learning notes.
What are your questions?
Outlook: Environmental Issues & Data
Review the 3 articles I shared.
- Briefly review the three articles I shared. There is no need to read them in detail.
- On your table and discuss (keep a record):
- Select a chart/ figure from the article that catches your eye.
- What is the environmental issue that the chart is about?
- What are the main points being communicated?
- What data is likely used to make this chart? Be specific …
- Is the chart effective? Why?
- Select a chart/ figure from the article that catches your eye.
- We will discuss your charts in the class.
Outlook
I am at a conference this week. We will not be meeting this week, but there will be asynchronous assignments. We will discuss these when I am back in Week 3.
In the next week, you will be working on some foundations including:
- What is open science and what are the benefits?
- Get ready to work with the tools of open science/ research
- Explore an environmental issue you care about (Prep for semester project)
Let’s have a look at the goals for next week: Week 2: Lesson Plan