Gridded data and weather effects
Background
Learning Goals
After this unit you should be able to
- describe the impact of resolution on weather and climate data
- be aware that comparing local station data and gridded data can be difficult
- explain the impact of topography and model resolution on gridded data products
Gridded data and weather/ climate data
Unlike observations that are taken at specific locations and represent that (and only that location), we have to think about the resolution of datasets when working with gridded data.
For example, rainfall (Figure 1) is highly variable in space and time and we can clearly see the impact of topography in the map below.

Typical resolutions
- Traditional climate models: Climate models are very computationally expensive. This means they were typically run at resolutions of \(1^\circ \times 1^\circ\) or \(2^\circ \times 2^\circ\). They lack sufficient detail to resolve topography, like the Blue Ridge Mountains, and local climate patterns. For example, current operational climate models, like the CMIP-6 (Coupled Model Intercomparison Project - Phase 6) models operate at a resolution of \(1.25^\circ \, \text{latitude} \times 2.5^\circ \, \text{longitude}\), which corresponds roughly to spatial grid resolutions of 100 to 250 km .
- Current climate models: Using today’s computational power, it is possible to run climate models at resolutions of 30-50 km over climate relevant timescales (i.e. the end of the century).
- Weather forecast models: Today’s global weather forecasts are run at resolutions of about \(16 \times 16 km^2\).
- Experimental climate models: Are currently run at spatial resolutions of 3-5 km, but this cannot yet be done globally for long periods.
- Short-term regional weather forecast: These weather models are run at resolutions of 3-5 km which is a high enough resolution to be able to model storms that are often 10 or so km across. The U.S. National Weather Service for example runs the he High-Resolution Rapid Refresh (HRRR) at 3 km resolution with a forecast window of 36 hours.
Impact of model resolution
Higher resolution models can better resolve weather patterns and are more likely to capture extremes. This is particularly apparent in rainfall, which is much more locally variable compared to temperature (Figure 2):

Figure 2: Return periods of extreme precipitation events using different thresholds as seen in the observations and SPEAR_HI. Source: Jong et al. (2023), npj climate When working with gridded data at coarser resolution it also means that the model output is averaged over a larger area, which then smooths out any local effects that are for example caused by geography and topography.
Impact of geography
Mountains change rainfall patterns: When moist air hits a mountain range, it is forced upwards and cools, which causes rain on the windward side of the mountain. On the leeward side, there is a rain shadow effect with less precipitation.
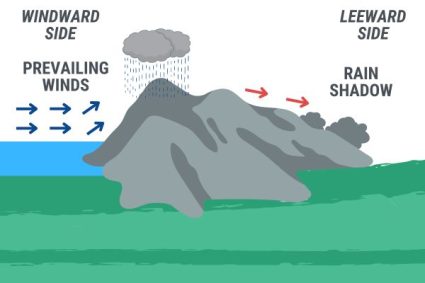
Credit: EarthHow Mountains and temperature: Higher altitudes have lower temperatures due to the lower atmospheric pressure which causes expansion of air and adiabatic cooling. This affects temperatures and climate. There are also effects of different insolation and shadows of mountains that will affect how much energy is received at the Earth’s surface.
Credit: EarthHow
Exercise
In the exercise on model resolution, we will explore the effect of spatial averaging on precipitation alone. This does not include any changes from model resolution.