Lesson Plan for Week 6
Objectives
Monday: We will finally define some semester projects and project groups.
Wednesday: After now knowing to work with timeseries data and having a handle on exploratory data analysis, we will make one step further. We will use streamflow data to fit a model for flood return period. This will help us understand how data can be used to inform statistical models. Flood return period is an important component of flood risk modeling, which for example underpins whether you can get a mortgage on a house or not.
Specific learning goals
- compare different distributions of environmental data
- relate environmental data to a statistical model that can be used to predict flood return rate
- close the loop from data to models
- understand the difficulty with forecasting/ predicting extremes values given limited data
Class Preparation
Readings
- Flood risk maps: Many people in the U.S. live in floodplains, which means that flood risk is a major hazard to life and property. In the U.S. a 1% flood risk, is considered too high to get a mortgage without flood insurance. You can explore flood risk using the Virginia Flood Risk Information System
- 100-year flood: A 1% flood risk is also called a 100-year flood. This means you expect such a flood to occur on average once every 100 years. Wikipedia has a good explanation on this.
Background: USGS Stream Gauge Data
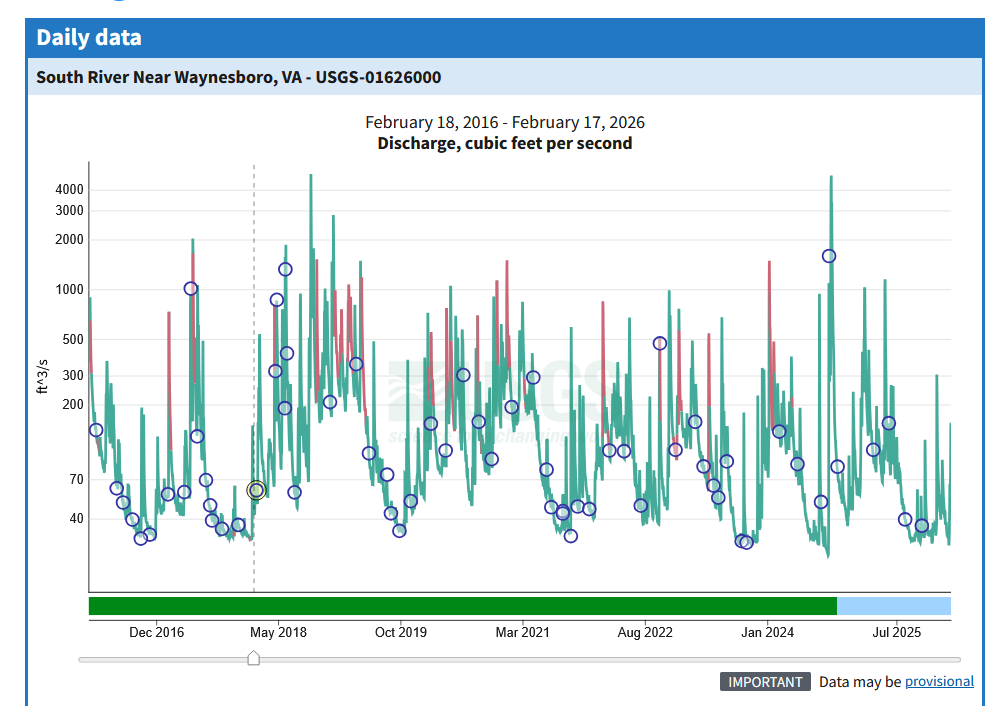
This week, we will be working with data collected at a stream gauge operated by the US Geological Survey. This gauge is located at the North River Near Waynesboro and provides daily stream discharge data in \(ft^3/s\). This location has been monitoring since 1952.
Mor information about the monitoring location is found on the USGS Waterdata Portal website.
The figure below shows you the kind of data that is being collected (Figure 1):
Planned Agenda
Monday:
- Introduce suitable data analysis topics
- Define/ select project topics or themes
- Assign project teams
- Group work to develop a problem statement draft
- Group work to refine topic to develop 2 initial research questions
- Team organization: Make joint github repository etc
Wednesday:
- Check-in
- Introduce next week goals
- Lecture: From data to models
- Demonstration: Fitting a statistical model for flood risk using USGS streamflow data
Assignments
- Create Team repositories on Github
- Develop a problem statement
- Locate suitable datasets