flowchart LR
  A(Environmental Issue) --> B(Specific Question)
  B --> C(Data Analysis Workflow)
  B1[Environmental Data] --> C
  C --> D(Product)
2. Getting Ready to Work
Motivation
During our first class meeting, I asked you to share an environmental issue you are interested in and (if I counted correctly) came up with 19 different issues including:
- environmental impacts of AI
- sea level rise
- coral reefs
- extreme weather
- …
If we want to solve these, we need to understand them and formulate specific questions that we can answer with data.
We also need to develop a workflow/ framework that can help us to so and that uses the correct tools that will make our lives easier.
Therefore, the goal for this week to build a foundation that allows us to jump into data analysis in the coming weeks.
Specific goals
- Learn about open science as an approach to environmental problem solving
- Install required software for this course
- Relate the software tools you installed to open science practices for environmental problem solving
- Explore how data can help us answer specific questions about an environmental issue
A framework for approaching environmental issues and problems
If we want to understand and solve any environmental issue, we have to think about how to approach the problem. I think that the below flow-chart (Figure 1) is a good (but not complete) visualization:
The first step, getting from an Environmental Issue to Specific Questions is harder than it seems and you will do an activity on that later.
For now, let’s focus on the big picture how can we be sure that data and data analysis
- are correct?
- trustworthy?
- benefit many people and not only a small group?
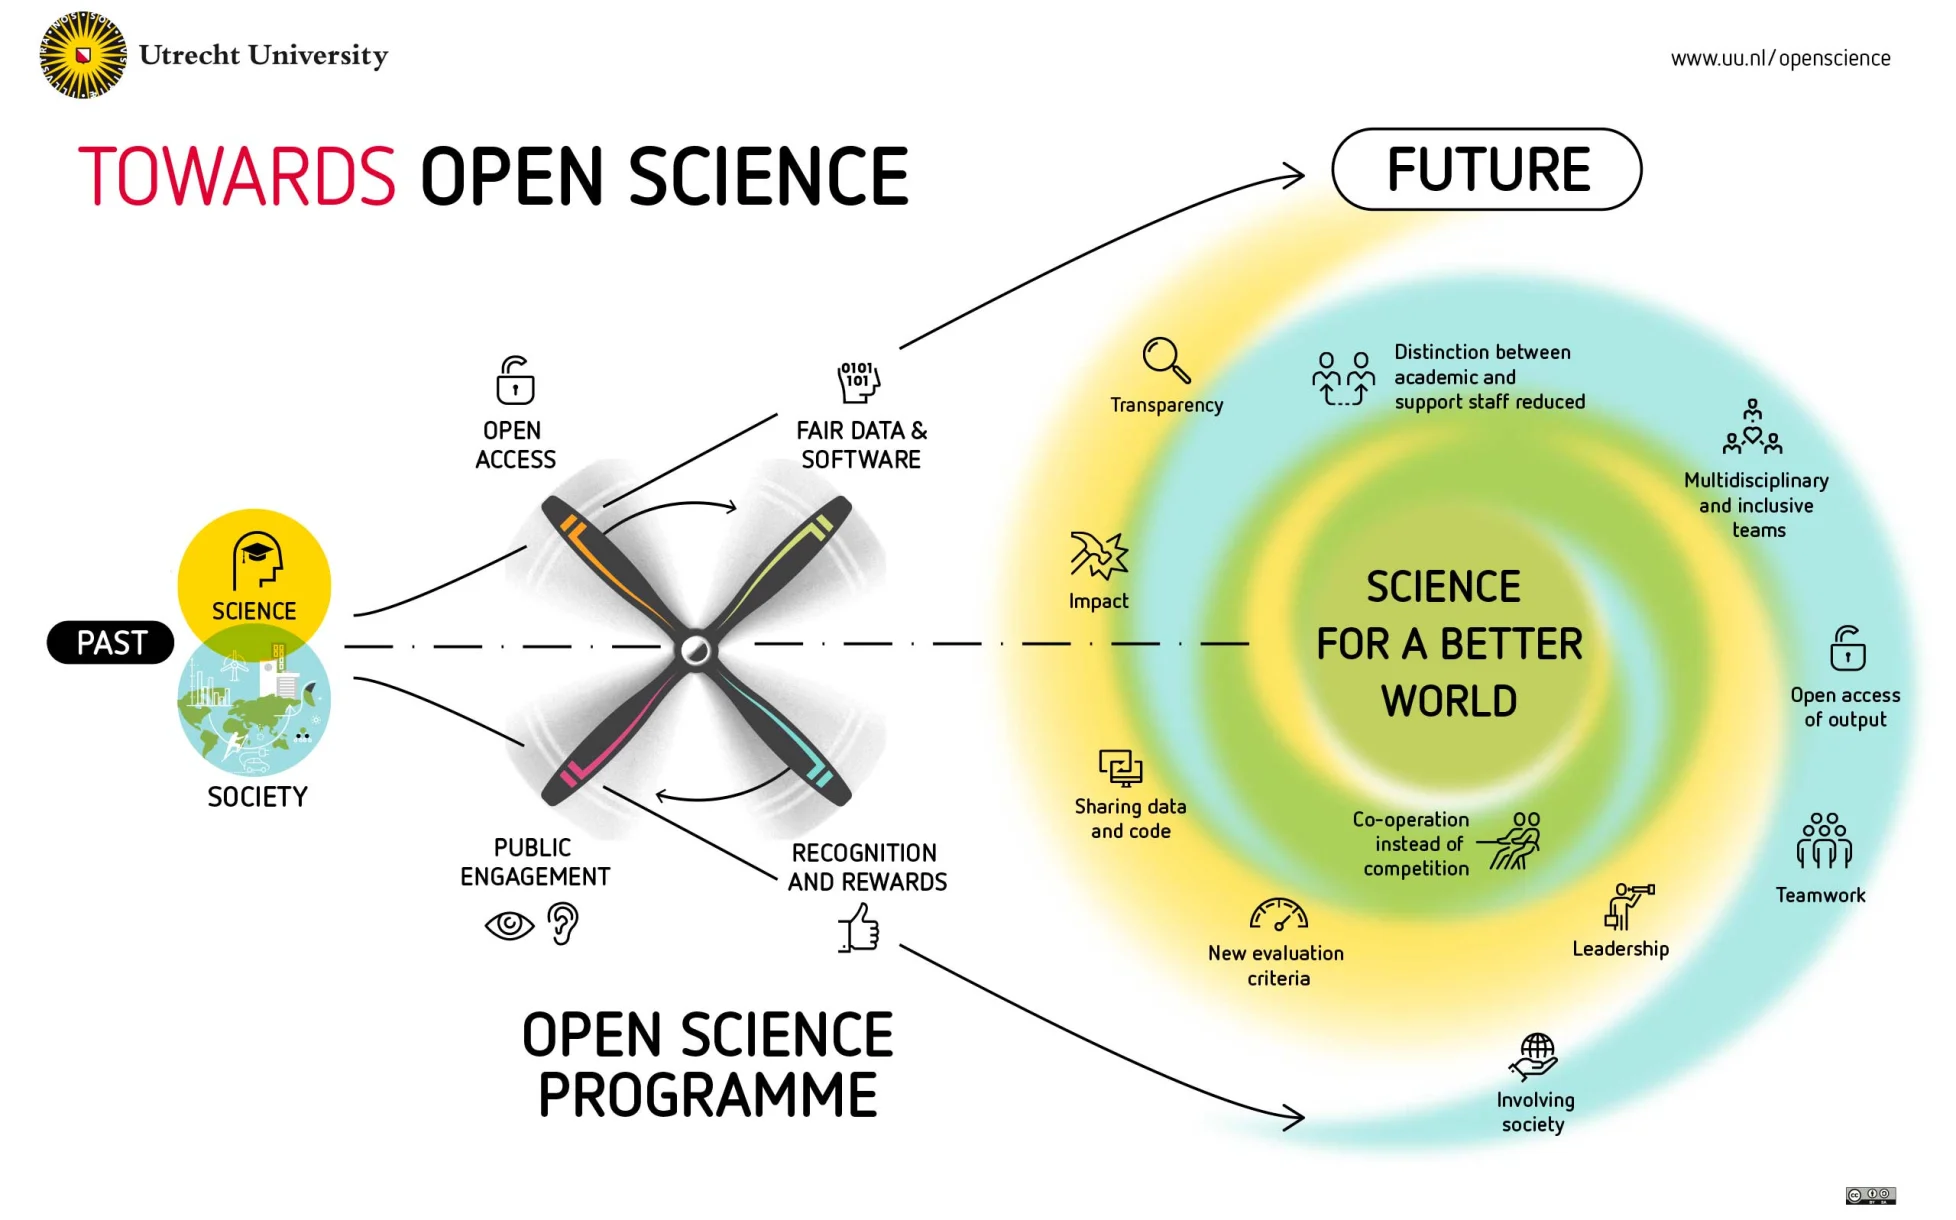
Open and accessible science
The practices for making data and research accessible to as many people as possible are often summarized as open science (Figure 2) and it responds to many of the questions raised above.
ImportantActivity 1: Understanding open science as a practice
Purpose
The goal for this activity is to learn about open-science as a practice and to develop an opinion about it.
Learning goals:
- Be able to define and describe open science principles
- Know and describe the components of FAIR
- Recognize the underlying values of open and accessible data analysis for solving complex problems (including environmental issues)
- Practice writing a learning note
Task
Read these articles about the issue (The Lesson Plan for Week 2 also has guiding questions for each reading.)
Write a short learning note that responds to the following questions:
- What problems are described in the readings?
- What are the negative consequences of the problems (and for whom in particular)?
- How do the solutions (open-science, FAIR principles) present a step in solving the problem?
- What are the underlying vales of open-science?
- Taking all readings together what is your main take-away?
- What is one thing you are curious about?
Submit your learning note to the corresponding assignment on Canvas and have it available next week.
Evaluation metrics
We are getting into the practice of taking charge of your own learning.
There is no specific point value attached to this particular learning note. However, regular completion of learning notes is part of the overall course grade.
I will review your notes and we will have a class discussion/ check-in about this.
Open and reproducible workflows
Now that you know a bit more about open science and its values and goals, it is time to think about what this means in practice.
Having open and accessible data is great, but how do we use it in ways that we can collaborate, trust our analysis, and share our results?
I think that the below excerpt summarizes this well:
- Reproducibility typically begins as something that someone imposes on you. It can be onerous and annoying. This typically lasts until you need to revisit a project after a small break. At that point you typically realize that reproducibility is not just a requirement for data science because it is the only way that we can make genuine progress, but because it helps us help ourselves.
- Reproducibility implies sharing data, code, and environment. This is enhanced by tools
- This is not an unimpeachable workflow, but one that is good enough and provides many of the benefits. We will improve various aspects of it through various tools, but improving code structure and comments goes a long way.
- There are always errors that occur, and it is important to recognize that debugging is a skill that improves with practice. But one key aspect of being able to get help is to be able to make a reproducible example others can use.
Alexander: Telling Stories with data (2024)
They key message for me is that this is a process and that it does not have to be perfect … and there are tools available to us that can help.
The tools of ISAT 420
Note
These tools are widely used in industry, computer and data science so that the skills you develop might come in handy in your later career.
The tools that we will be using in this class are introduced in the Tools section. All of these tools are freely available and free to use.
ImportantActivity 2: The tools we will use - Getting work ready
Purpose
This activity has two main purposes:
- I want you to explore the tools, what they are, and why we are using them.
- We also need to take care of some admin and get ready to work. So this week is a good time to take care of this and to install the software you need.
Learning goals/ Outcomes:
- Describe the relationship between Python, Jupyter Notebooks, and Anaconda for our data analysis
- Explain how each tool contributes to making our workflows more open, reproducible, and accessible
- Have a working Anaconda Python distribution
- Have a Github account and be able to access it with Github Desktop
NoteA note for experienced Python and git users
This course uses Anaconda to provide an accessible portal to Python and managing Python packages. In this course you will work with jupyter notebooks and need access to many of the Pangeo packages. If you are using another package-management system, please let me know and I can tell you whether this works as well.
The same goes for git. Github Desktop provides a graphical user interface to git and GitHub. If you prefer to interact with git in a different way, that is fine but you are on your own.
Tasks
Explore the tools page and the tools listed.
Research each tool to find out more about it (what it does, its purpose). At the end, you should have a pretty clear idea what the tool might be used for in ISAT 420.
Write down any questions that you have.
Install and test Anaconda on your laptop computer following the posted instructions: Anaconda Instructions
Create a GitHub Account and install Github Desktop following the posted instructions: GitHub and GitHub Desktop Instructions
Navigate to github.com and check wether your repository appears on your
DashboardWrite a short learning note that responds to the following questions:
- How can each of the tools you researched and installed contribute to making science more open, reproducible, and accessible?
- What are the things that are currently most unclear to you?
- What is something you are curious about?
Submit your learning note and a screenshot of your
Hello-ISAT-420repository to the corresponding assignment on Canvas.Also, include your GitHub user name and the email that you used to sign up for GitHub. I will need these to create Teams on GitHub (more about that next week).
Evaluation metrics
As mentioned above, this is about getting ready and knowing the tools and the why about them. Please make sure that you have enough time to install and test the software. If you run into problems, please let me know as early as possible, so that we can trouble shout before the next class on Monday.
Getting ready - Part: Start thinking about environmental issues and data
At the very beginning of the lesson, I briefly mentioned the relationship between environmental issues, specific questions, and data seen in Figure 1.
The last part of this week’s activities is to explore this a bit more.
ImportantActivity 3: Environmental issues, questions, and data
Purpose
We are mixing some research about an environmental issue with some practice about the tools that you will be using.
The main content goal is to explore an environmental issue and to practice how to ask questions that can be solved with data and then to see whether such data is easily accessible to you.
Learning goals:
- Link broad environmental issues to specific questions that are answerable with data
- See whether/ what data is accessible to you and what sources exist
- Practice writing your note in markdown using an online editor
Task
- Select one environmental issue you care about (it can be the one from our intro lecture)
- Conduct some research on the issue to describe the problem
- Formulate at least two specific research questions that you think can be answered with data
- Describe what specific data you would need (location, types of measurements, frequency, …)
- Conduct additional research to see whether you can find such measurements.
- Are they accessible to you (if not what do you think hinders your access)
- Craft a learning note using the dillinger online markdown editor and record your findings.
- Use the markdown example to see how you can give your note a title and headings. You can also look at this markdown cheat sheet to see the formatting commands
- Include at least one list
- Include at least one link to a website
- Give your note a sensible name (e.g.
<your name>_<problem>_ISAT420.md) and download your note as a Markdown file using theExport Asoption on the top bar. - Save your note in the same place as the other note and upload a copy to the corresponding assignment on Canvas.
Evaluation Metrics
This assignment is part of our journey and preparation for selecting good problems for our team-based semester project.
I will review your notes and we will have a class discussion/ check-in about this.
Final Thoughts
You made it!

I understand that we are doing a lot of new things right now and not everything was easy. We will talk about your experience next week, when I am back.