flowchart LR
  A("<s>Data Collection</s>") --> B("<s>Data Cleaning</s>")
  B --> C(Data Analysis)
  C --> D(Data Visualization)
  D --> E(Data Communication)
3. Open Data, Tools, and Workflows
Motivation
The goal for this week to build a foundation that allows us to jump into data analysis in the coming weeks.
Specific learning goals
After completing this unit, you will be able to
- Define open reproducible science and explain its importance.
- Describe how reproducibility can benefit yourself and others.
- Evaluate data and workflows according to open-science principles including FAIR.
- List tools that can help you implement open reproducible science workflows.
- Explain why version control is useful in a scientific workflow.
- Explain how a GitHub repository stores and tracks changes to files.
Skills:
- Use GitHub-Desktop to track changes in files using
git commitandgit push. - Create a new git repository and publish the repository on GitHub.com.
- Create a copy of (i.e.
fork) other users’ files on GitHub.com. - Use the
git clonecommand to download a copy of a GitHub repository to your computer.
Recap: Data Analysis Workflow
We can describe the data analysis workflow as a linear sequence of steps (Figure 1):

However, this workflow is embedded into a larger context of doing open-science.
Recap: Open Science and Workflows
Open and reproducible science is a collection of practices (Figure 2) that allow us to easily share, work and collaborate with others1.

Benefits of Open Reproducible Science
Benefits of openness and reproducibility in science include:
- Transparency in the scientific process, as anyone including the general public can access the data, methods, and results.
- Ease of replication and extension of your work by others, which further supports peer review and collaborative learning in the scientific community.
- It supports you! You can easily understand and re-run your own analyses as often as needed and after time has passed.
What does this mean in practice?
- Use scientific programming to process data
- Allows you to automate tasks
- Provides a written ‘recipe’ that is always followed the same way
- Organize your work using expressive names for files and directories
- See the paper I shared on organization
- Use FAIR data to enhance the reproducibility of projects
- Protect your raw data
- Make sure your raw data is not modified
- Keep outputs separate from inputs
- Organize your work in directories
- Use version control
- Allows you to track and manage any changes to your code
- Allows you to publish your code
- Document your workflows
- Use tools that document workflows
- Describe and add comments to your code
- (Can be many other things as well)
A case study
Hey ISAT 420 Students,
I found this cool dataset online and I want you to check this out. The data is attached to this email.Best wishes, TG
TipReflection Questions:
- Look at
data.csv - What are the issues with this dataset?
- What do you think the dataset represents
- How would you go on to analyze the data?
FAIR and Open Data
It is impossible to know from the csv that I shared with you, what the data represents.
The dataset I shared is the global carbon budget for the year 2023 (Figure 3), which is compiled by the Global Carbon Project:
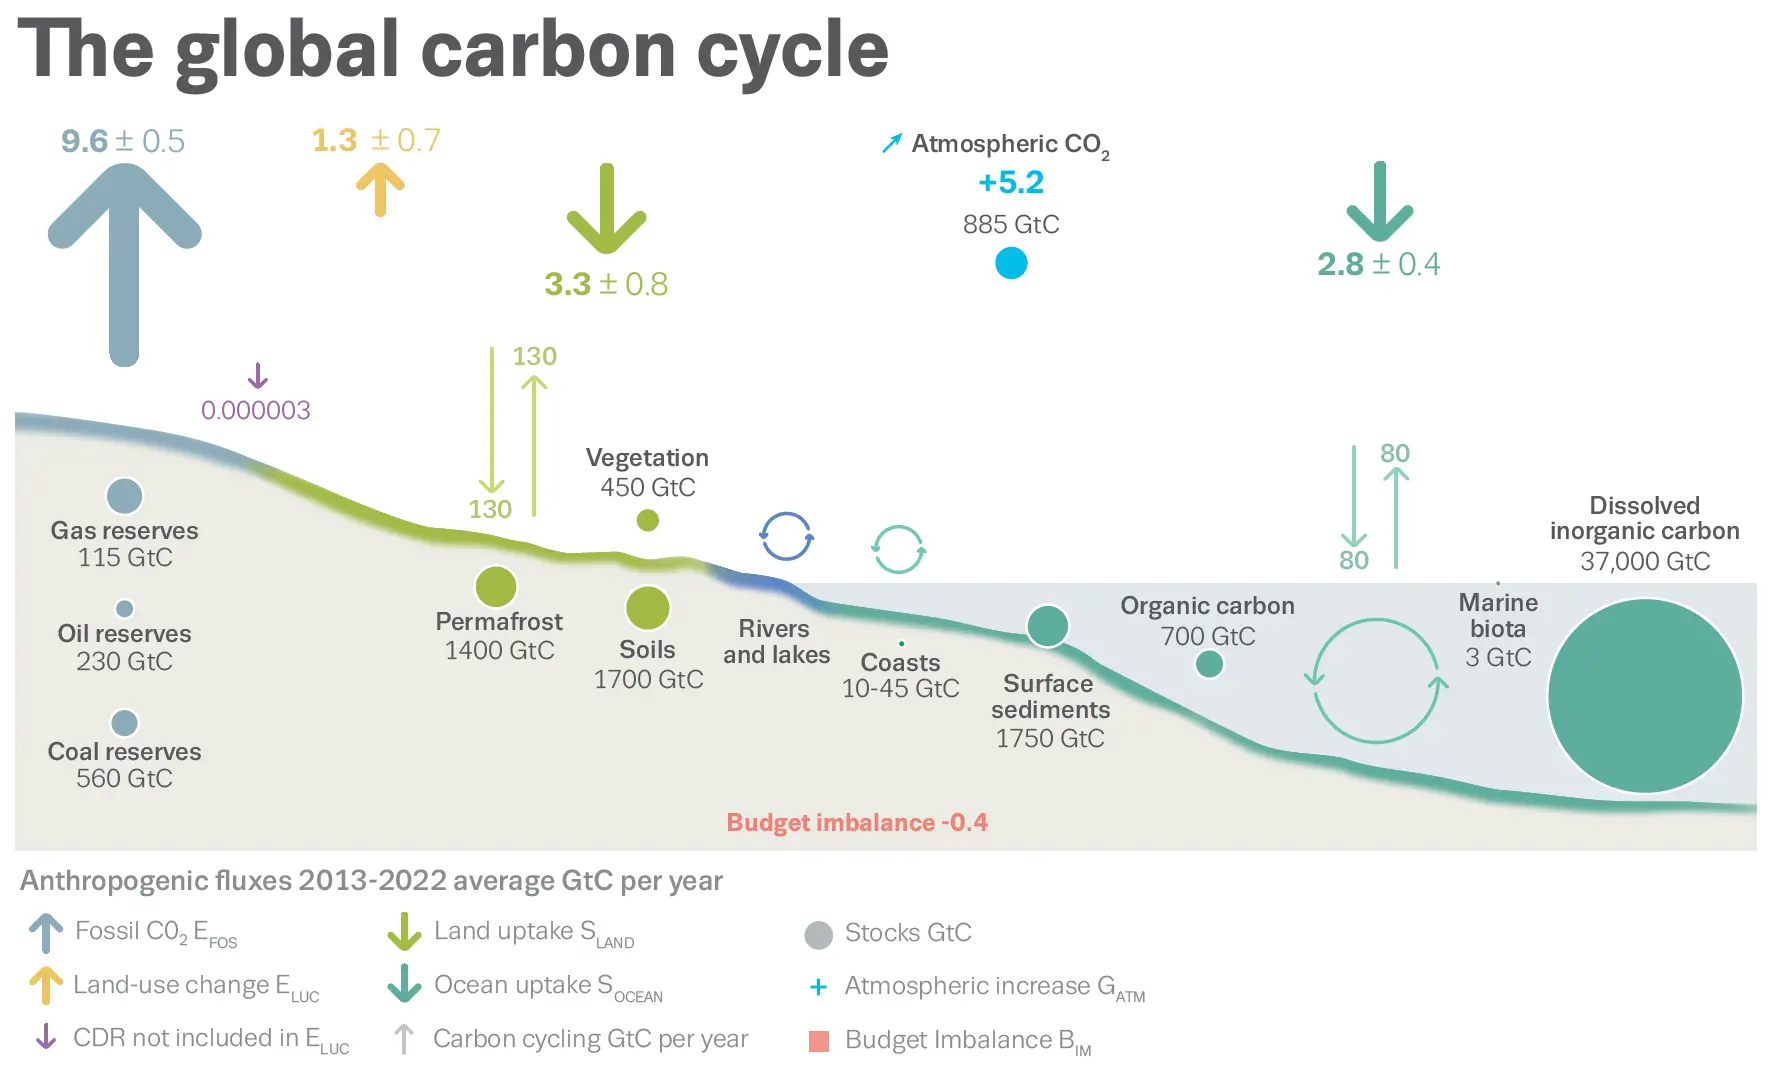
This dataset is actually fairly well described and documented. This includes the website and an article in the open-access journal: Earth System Science Data2
Data Analysis Process
Ok, we now know where the data is coming from, what is represents, and that it is likely trustworthy.
So let’s think about what we can do with this. Considering our data analysis workflow (Figure 4):
How can we do this in a transparent and reproducible way?
Using the tools that we have
We can use Jupyter Notebook to read, process, and visualize our data. The most simple code for our analysis might be something like:
Step 1: Read the dataset
Step 2: Make some calculations to process our data
Step 3: Make a visualization of our data
Step 4: Save the plot as a file
Demonstration: Jupyter Notebook
The code is found on GitHub: https://github.com/ISAT-DrG/ISAT_420_S26_Shared
Checking what we have done for reproducibility
Remember, being reproducible is not all or nothing. Let’s see which criteria we are currently doing well with …
… and what we could do to improve.
Git and GitHub for Transparency and Reproducibility
The code I just demonstrated is part of a git repository that is hosted on GitHub.
This means that any changes to the code are tracked within the git repository and the code is also quasi-archived.3
We use git and GitHub as a version control system (Figure 5):

This also means that different users can make independent changes to the same document (Figure 6):

If there are conflicts between the users’changes, these conflicts can be resolved by choosing which changes you want to keep (Figure 7):

Demonstration: Updating our analysis for 2025
Let’s say we want to make a change in our analysis. This change should be transparent and reproducible.
We can use git and GitHub for this.
Step 1: Make and save changes
Step 2: Commit change
Step 3: Push our changes to GitHub
We can now examine the changes in the Github Repository (or also using GitHub-Desktop).
Practice: Git workflow: Commit and Synching Changes with GitHub
TipActivity: Create a repository using GitHub Desktop and make a change
Goal: Practice what we just learned
- Create a new repository using GitHub Desktop
File\(\rightarrow\)NewRepository - View the files:
Show in Explorer(Windows) orShow in Finder(Mac) - Add a new text document with some text:
test.txt - Commit your new file with a message:
Added a new test file - Modify your text file by adding some additional text.
- Commit your changed file with a message:
Changed file content - Push your change to
GitHub - View your changes on
GitHub.com
Git and GitHub for sharing and collaboration
Getting Code from GitHub - Git workflow: Fork and Clone
Let’s say we are doing open-science and have found some freely-available code on GitHub that we want to build on. What can you do to get started?
Create a Copy of Other Users’ Files on GitHub.com (Fork a Repo)
Using GitHub.com, you can make a copy of a GitHub repository (also known as a repo) owned by another user or organization (a task referred to as forking a repository).
To fork a repo:
Navigate to the repo that you wish to fork. Example:
https://github.com/ISAT-DrG/ISAT_420_S26_SharedOn the upper right corner you will see a button that says
Fork(Figure 8)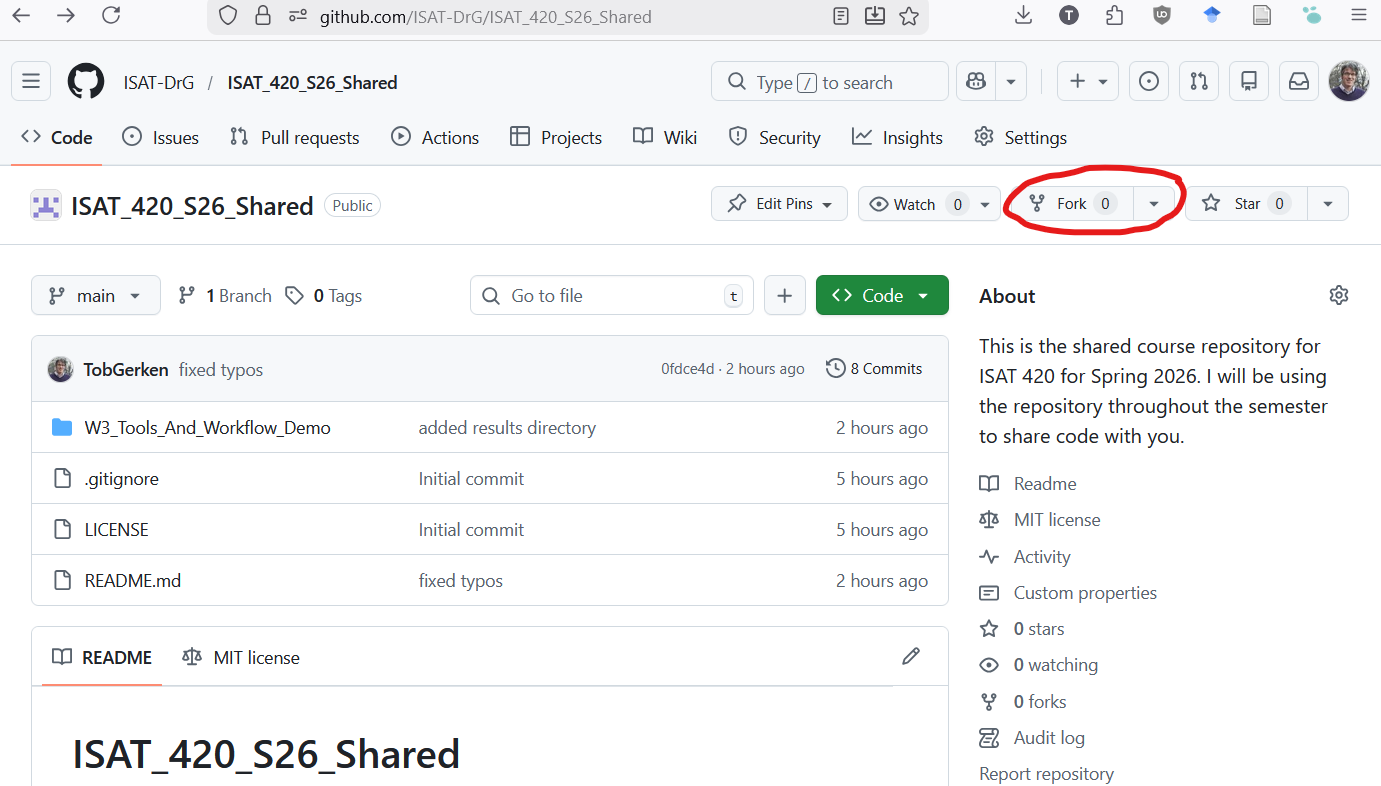
Figure 8: To fork a repo, first navigate to the repo you want to fork. Then click the forkbutton in the upper right hand corner of your screen. You can then create a copy of of this repo in your account.Click on the
Forkbutton and select your user account when it asks you where you want to fork the repo.You can now use GitHub-Desktop to create a local copy of the repository on your computer.
File\(\rightarrow\)Clone Repository- Select the forked repository from the list
- Decide on where you want to save the repository:
Local path - Hit the button:
Clone
Collaborating with Shared Code
Often times, there is a central repository with code that many people are contributing to. This includes many of the Python packages that are part of the Pangeo ecosystem. To manage this collaboration, individual contributors are working on their own forked copies of the project. When they are ready to share (or suggest) a change to the overall project, they can use a Pull Request (Figure 9).
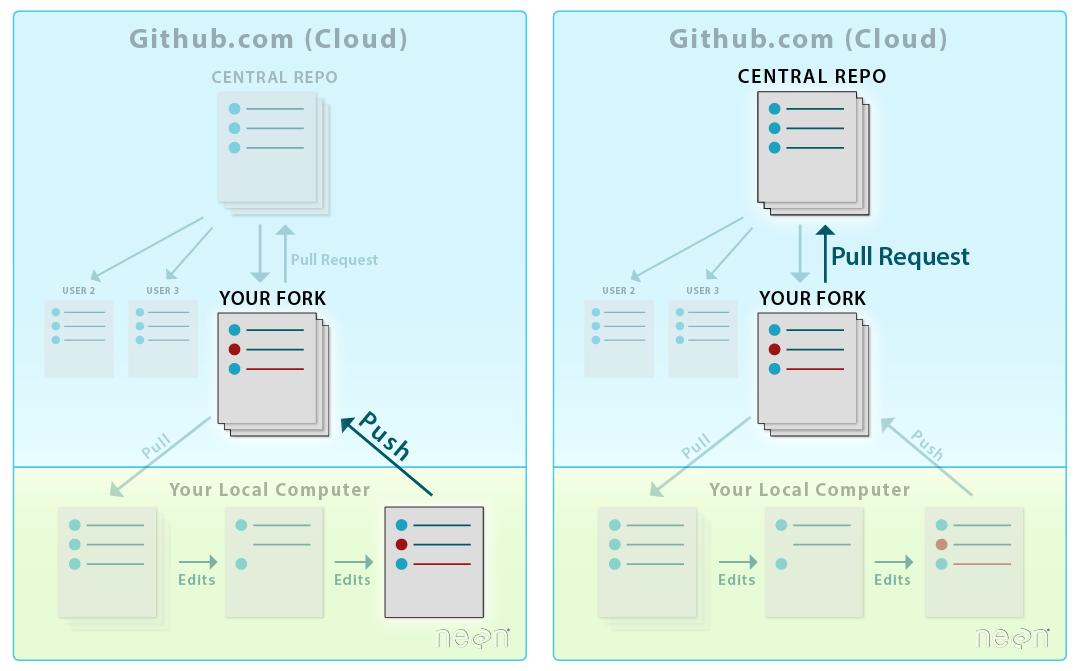
A Pull Request is a workflow that allows
- Your collaborators to see exactly what items where changed line by line
- A group of people to view, review, and comment on the code line by line
- Approve or reject any changes that will then be merged into the base repository.
GitHub Workflow: Creating a Pull Request
For now, we don’t need to know this workflow in detail. However, it is described in Chapter 8, Lesson 2 of the CU-Boulder Intro to Earth Data Science Textbook (2025)
Wrap-up
TipSkills/ Tool Check
Can you
- use Github-Desktop to create a new repository?
- publish your repository to GitHub (set to private)?
- add a file to your repository,
committhe change, andpushthe change to GitHub? forkandclonea shared repository so that you have the contents on your computer?- Clone the course repo: https://github.com/ISAT-DrG/ISAT_420_S26_Sharedk
- use Anaconda to run a jupyter notebook on your computer?
- Open jupyter notebook and run the first couple of cells of this notebook:
w3_basic_python_test.ipynb - I recommend to run the rest at home to get a refresher on how python works.
- Open jupyter notebook and run the first couple of cells of this notebook:
Acknowledgements
The content and activities on this page are in a large part based on the CU-Boulder EarthLab Intro to Earth Data Science Textbook (2025). Relevant chapters are:
- Chapter 1: Open Reproducible Workflows
- Chapter 7: Git and GitHub for Version Control
- Lesson 1. What is Version Control?
- Lesson 2. Copy (Fork) and Download (Clone) GitHub Repositories
- Chapter 8: Git/ GitHub for Collaboration
- Lesson 1. Learn How To Use GitHub to Collaborate on Open Science Projects
- Lesson 2. How To Create A Pull Request on Github: Propose Changes to GitHub Repositories
Footnotes
CU Boulder’s Intro to Earth Data Science (2020) textbook , Section 1: Introduction to Open Reproducible Workflows↩︎
A bit of shameless bragging here: I am a topic editor for this journal. This means, I help govern the policies of this journal as well as administer the review process for articles.↩︎
Technically GitHub should not be relied on to be the solve code archive because there is no guarantee that GitHub or the company that owns it will always exist.↩︎